Cardano Continues Its Sideways Move as It Faces Stiff Resistance at $0.51
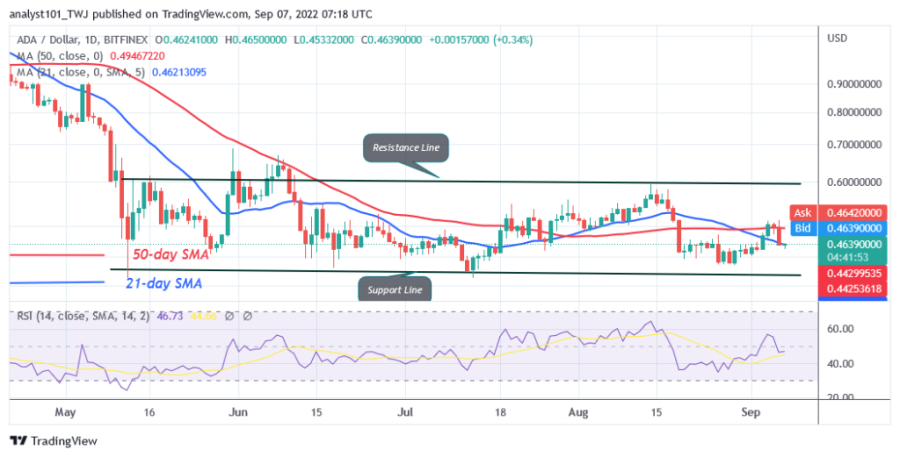
The price of Cardano (ADA) is in a sideways trend, but has resumed selling pressure after rejecting the $0.51 high. On September 4, buyers pushed the altcoin above the moving average lines but failed to sustain the bullish momentum above it.
The recent rally drew selling pressure as Cardano fell below the moving average lines. The altcoin dropped to the low of $0.46 and held above it. The cryptocurrency could fall further to the lows of $0.42 and $0.40. However, if ADA rises back above the support of $0.46, the altcoin will rise to the high of $0.51. The bullish momentum will extend to the high of $0.60. At the time of writing, Cardano is trading at $0.46.
Cardano indicator analysis

ADA is at the 46 level of the Relative Strength Index for the 14 period. It is in the downtrend zone because of the recent decline. The altcoin is rising above the support of $0.46. Cardano will be forced to a range bound move between the moving average lines if it breaks above the 21-day line SMA. Cardano is below the 40% area of the daily stochastic. ADA /USD is in a bearish momentum.
Technical indicators
Key Resistance Zones: $0.60, $0.70, $0.80
Key Support Zones: $0.50, $0.40, $0.30
What is the next move for Cardano?
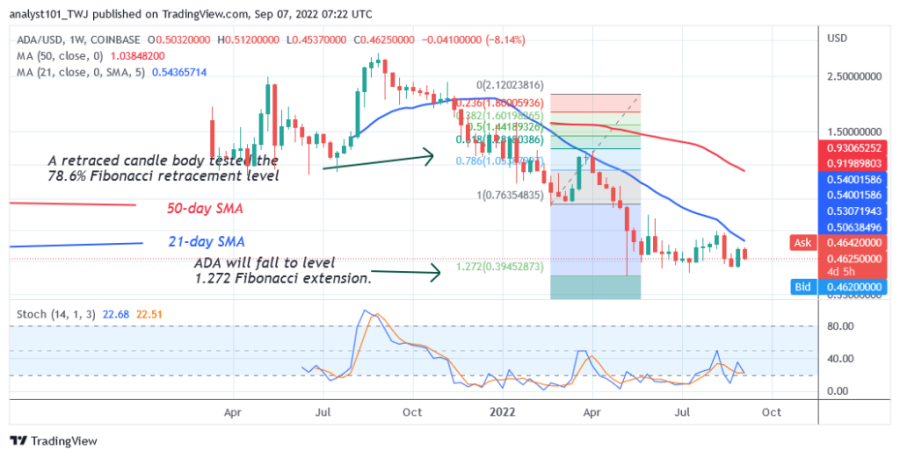
The price of Cardano is a downward correction. Since May 9, the cryptocurrency has consolidated above the $0.39 support. On the weekly chart, a candlestick has tested the 78.6% Fibonacci retracement level of March 28. The retracement suggests that ADA will fall, but will reverse at the level of the 1.272 Fibonacci extension, or $0.394.
Disclaimer. This analysis and forecast are the personal opinions of the author and are not a recommendation to buy or sell cryptocurrency and should not be viewed as an endorsement by CoinIdol. Readers should do their own research before investing in funds.
Source: Read Full Article