Binance Coin Circles Above $315 And Takes Aim At Previous Highs
Binance Coin (BNB) price is rising after breaking above the 21-day line SMA.
Binance Coin price long term forecast: bullish
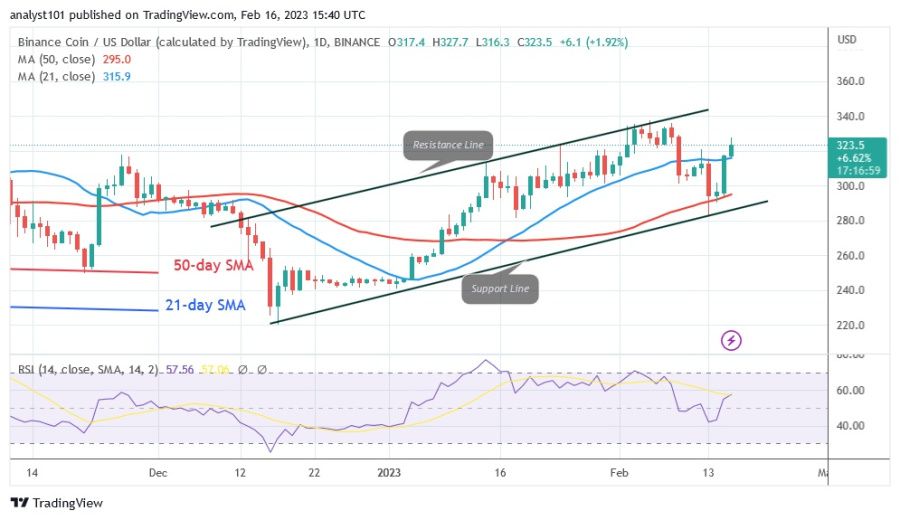
On February 13, BNB fell to a low of $283. In other words, the cryptocurrency fell within the moving average lines. Before the breakout on February 15, the cryptocurrency was moving in a range, but BNB will rise to its previous highs of $335 and $361 if the current upward momentum above the moving average lines is maintained. The cryptocurrency price is currently circling above the moving average lines. BNB will fall and return to the area between the moving average lines if the cryptocurrency price falls below the 21-day moving average. At the time of writing, BNB/USD is currently trading at $319.40.
Binance Coin indicator display
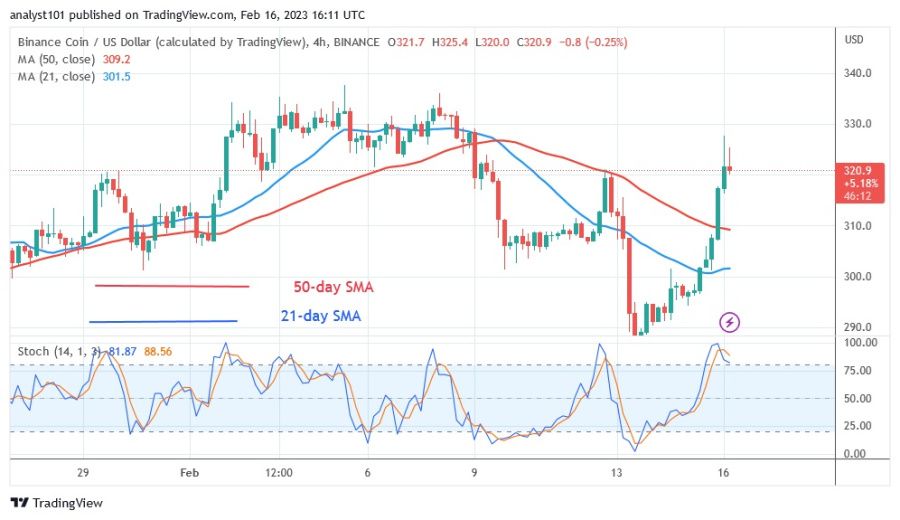
BNB has reached the 55 level of the Relative Strength Index for the 14 period due to the recent positive momentum. The price of the cryptocurrency is in a bullish trend zone and could rise. The price of the cryptocurrency could rise as the price bars are back above the moving average lines. Meanwhile, BNB has reached a stage where the market is overbought. It is above the daily stochastic value of 80. Since BNB is overbought, it can fall.
Technical indicators:
Key resistance levels – $600, $650, $700
Key support levels – $300, $250, $200
What is the next direction for BNB/USD?
Binance Coin has crossed above the moving average lines. If the altcoin breaks above the moving average lines, a new uptrend will start. The initial resistance for the altcoin is at the high of $325. Since the market has entered an overbought zone, further gains are unlikely.
Disclaimer. This analysis and forecast are the personal opinions of the author and are not a recommendation to buy or sell cryptocurrency and should not be viewed as an endorsement by CoinIdol. Readers should do their research before investing in funds.
Source: Read Full Article


