Binance Coin in Bearish Triple Top Pattern, May Decline
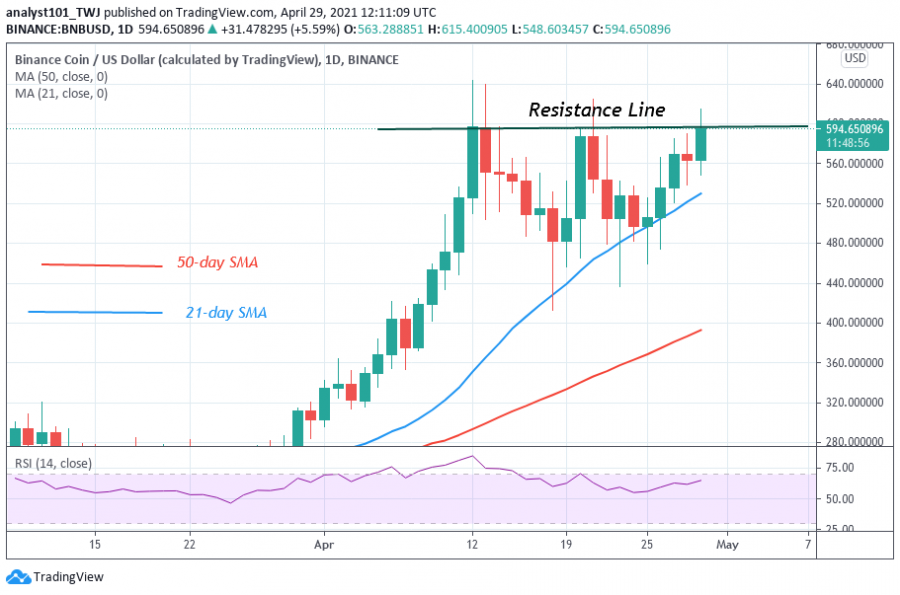
Binance Coin has rallied to retest the $600 overhead resistance for the third time. Buyers have relentlessly tested the overhead resistance on April 12, 20, and 29. The market will rally to $900 if the overhead resistance is breached.
However, if Binance Coin faces rejection, the price action will indicate a bearish triple pattern. The implication is that BNB/USD is likely to plunge to the downside if the bulls fail to break the resistance level convincingly. The altcoin is trading at $612.22 at the time of writing. The price indicator has shown a possible downward movement of price.
Binance Coin indicator reading
The altcoin is at level 66 of the Relative Strength Index period 14. It is in the uptrend zone and approaching the overbought region of the market. The 21-day and 50-day SMAs are pointing northward indicating the uptrend.
Technical indicators:
Major Resistance Levels – $440 and $460
Major Support Levels – $200 and $180
What is the next direction for BNB/USD?
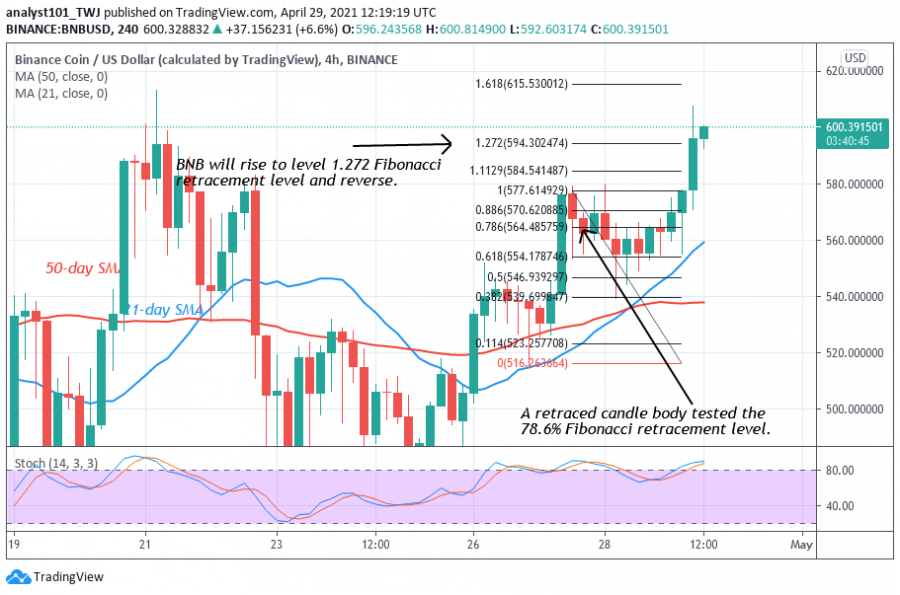
Binance Coin price upward move is marginal. BNB price may break the overhead resistance but the bullish momentum may not be sustained. On April 27 uptrend; a retraced candle body tested the 78.6% Fibonacci retracement. This retracement indicates that the market will rise to level 1.272 Fibonacci extensions or the high of $594.30. From the price action, the market has broken the overhead resistance. It is not clear if the bullish momentum will be sustained.
Disclaimer. This analysis and forecast are the personal opinions of the author that are not a recommendation to buy or sell cryptocurrency and should not be viewed as an endorsement by CoinIdol. Readers should do their own research before investing funds.
Source: Read Full Article


