Binance Coin Is In A Narrow Range Under $320 High
Binance Coin (BNB) price is currently bearish after turning down twice at the $340 threshold.
Binance Coin price long term forecast: bullish
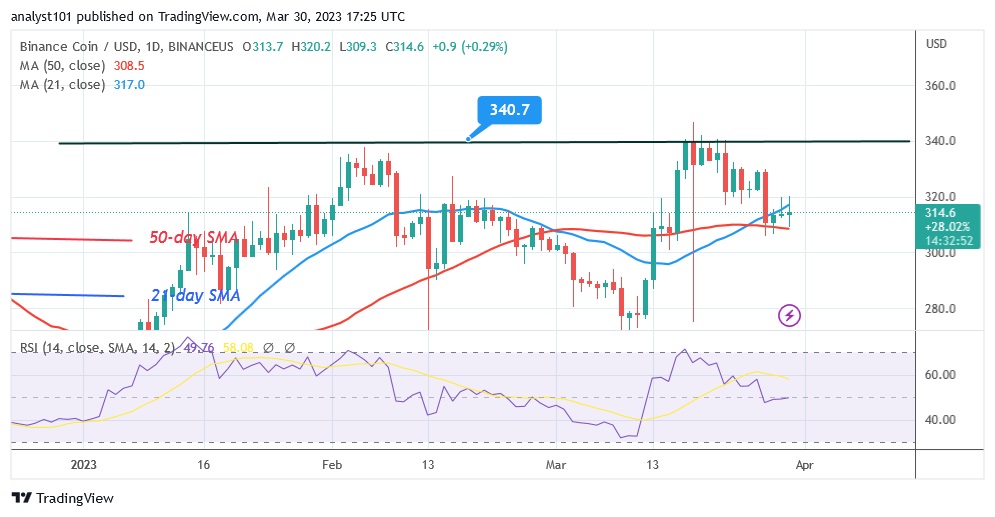
After the decline, the altcoin is currently trading between the moving average lines. BNB has fallen to a low of $316 at the time of writing. Selling pressure has eased as BNB is between the moving average lines. BNB trends when the moving average lines are crossed. The 21-day line SMA is currently being topped by the BNB price. If the 21-day line SMA is broken, the altcoin will rise to a previous high of $340. Since November 2022, buyers have failed to keep the price above the $340 high. If the price falls below the 50-day line SMA, the downtrend will resume. The crypto asset has maintained its position above the support level of $280.
Binance Coin indicator display
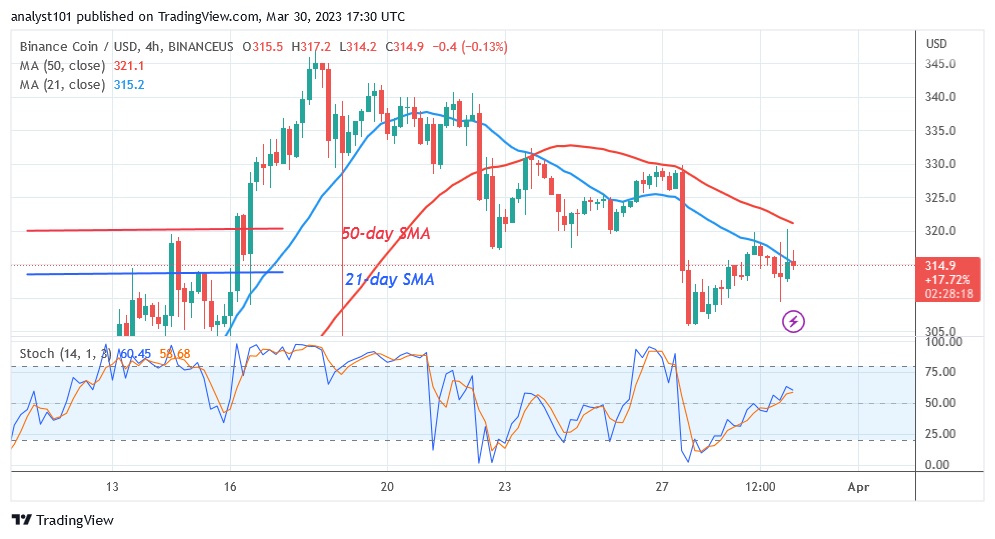
During period 14, BNB is at level 49 of the Relative Strength Index. As supply and demand balance out, the cryptocurrency’s price has reached its equilibrium level. As long as the price bars are between the moving average lines, the altcoin will move in a range. The altcoin is moving up above the daily stochastic value of 50.
Technical indicators:
Key resistance levels – $600, $650, $700
Key support levels – $300, $250, $200
What is the next direction for BNB/USD?
The Binance Coin is trading between the moving average lines. In other words, it is between $300 and $320. The altcoin is trading in a narrow range that will lead to a breakout. The altcoin will develop a trend when it breaks out of the moving average lines.
Disclaimer. This analysis and forecast are the personal opinions of the author and are not a recommendation to buy or sell cryptocurrency and should not be viewed as an endorsement by CoinIdol. Readers should do their research before investing in funds.
Source: Read Full Article


