
Bitcoin Cash Price Could Restart Rally To $300 If It Breaks This Resistance
Bitcoin Cash price started a downside correction and tested $230 against the US Dollar. BCH might aim a fresh rally toward the $280 and $300 levels.
- Bitcoin cash price is consolidating above the $230 level against the US Dollar.
- The price is trading below $255 and the 100 simple moving average (4 hours).
- There was a break above a key bearish trend line with resistance near $242 on the 4-hour chart of the BCH/USD pair (data feed from Kraken).
- The pair is likely to accelerate higher if it clears $255 and $265.
Bitcoin Cash Price Prepares For The Next Move
After a strong rally, Bitcoin Cash price faced sellers near the $300 zone. BCH traded as high as $294 and started a downside correction, like Bitcoin and Ethereum. There was a move below the $280 pivot level.
The price even declined below $255 before the bulls appeared near $230. A low is formed near $232 and the price is now slowly moving higher. There was a break above a key bearish trend line with resistance near $242 on the 4-hour chart of the BCH/USD pair.
The pair cleared the 23.6% Fib retracement level of the downward move from the $294 high to the $232 low. Bitcoin Cash is now trading below $265 and the 100 simple moving average (4 hours).
Immediate resistance is near the $255 level. The next major resistance is near $265 or the 100 simple moving average (4 hours). It is close to the 50% Fib retracement level of the downward move from the $294 high to the $232 low.
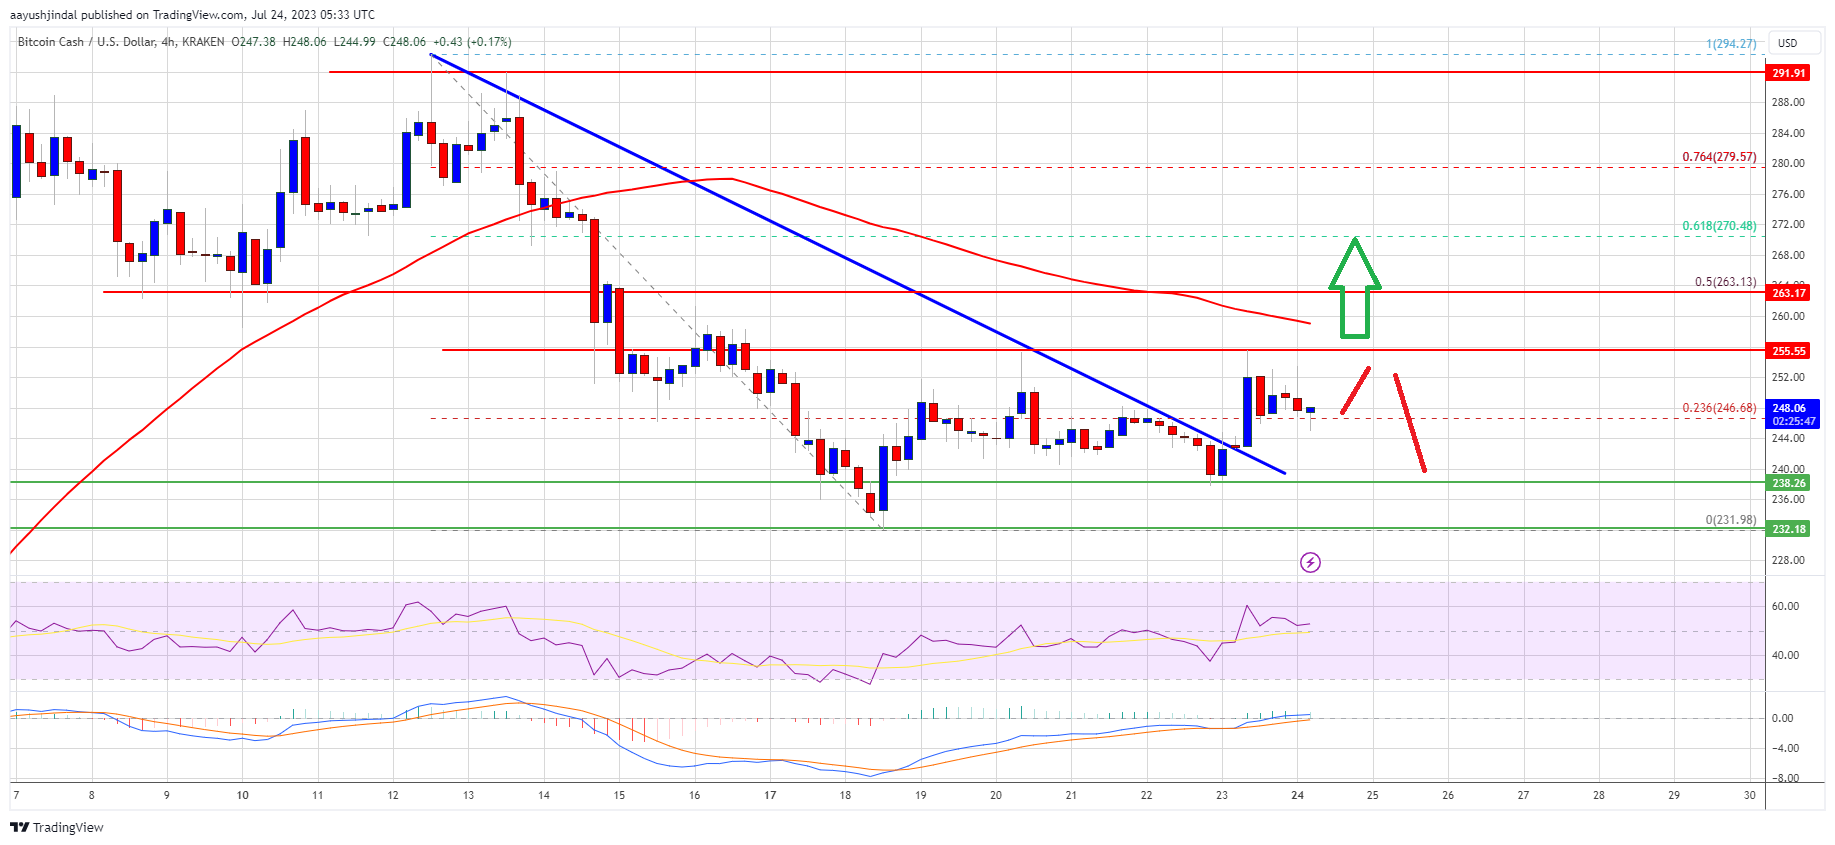
Source: BCH/USD on TradingView.com
Any further gains could lead the price toward the $280 and $285 resistance levels in the near term. The next major hurdle is near the $300 level.
Dips Supported in BCH?
If Bitcoin Cash price fails to clear the $255 resistance, it could start a fresh decline. Initial support on the downside is near the $240 level.
The next major support is near the $232 level, where the bulls are likely to appear. If the price fails to stay above the $232 support, the price could test the $220 support. Any further losses could lead the price toward the $200 handle in the near term.
Technical indicators
4-hour MACD – The MACD for BCH/USD is gaining pace in the bullish zone.
4-hour RSI (Relative Strength Index) – The RSI is currently above the 50 level.
Key Support Levels – $240 and $232.
Key Resistance Levels – $255 and $265.
Source: Read Full Article