
Bitcoin Price Hints At Potential Correction, Buy The Dip?
Bitcoin price is again moving lower from the $27,500 resistance. BTC could extend its decline and revisit the $25,400 support zone.
- Bitcoin started a downside correction after it failed to clear the $27,500 resistance.
- The price is trading below $27,000 and the 100 hourly Simple moving average.
- There was a break below a major bullish trend line with support near $26,800 on the hourly chart of the BTC/USD pair (data feed from Kraken).
- The pair is now at a risk of more downsides below the $26,350 level.
Bitcoin Price Revisits Support
Bitcoin price started a downside correction after it failed to clear the $27,500 resistance. BTC traded below the $27,000 and $26,800 support levels to enter a bearish zone.
Besides, there was a break below a major bullish trend line with support near $26,800 on the hourly chart of the BTC/USD pair. The pair retested the $26,350 support zone and is currently consolidating losses. It is trading near the 23.6% Fib retracement level of the recent decline from the $27,494 swing high to the $26,358 low.
Bitcoin is now trading below $27,000 and the 100 hourly Simple moving average. Immediate resistance on the upside is near the $26,800 level. The first major resistance is near the $27,000 zone, a connecting bearish trend line, and the 50% Fib retracement level of the recent decline from the $27,494 swing high to the $26,358 low.
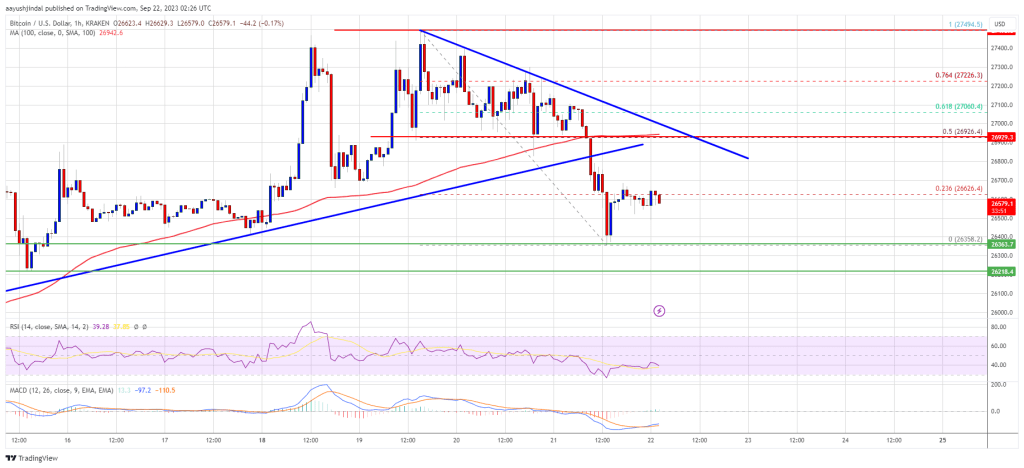
Source: BTCUSD on TradingView.com
The next key resistance could be near the $27,050 level, above which the price could gain bullish momentum. In the stated case, the price could even rise toward the $27,500 resistance. Any more gains might call for a move toward the $28,800 level in the coming days.
More Losses In BTC?
If Bitcoin fails to start a fresh increase above the $27,000 resistance, it could continue to move down. Immediate support on the downside is near the $26,350 level.
The next major support is near the $26,200 level. A downside break and close below the $26,200 level might spark more bearish moves and the price could decline toward the next support at $25,400.
Technical indicators:
Hourly MACD – The MACD is now losing pace in the bearish zone.
Hourly RSI (Relative Strength Index) – The RSI for BTC/USD is now below the 50 level.
Major Support Levels – $26,350, followed by $26,200.
Major Resistance Levels – $27,000, $27,050, and $27,500.
Source: Read Full Article