Dogecoin Poised for a 150% Surge? Key Price Levels to Watch
The price trajectory of Dogecoin has been significantly influenced by Elon Musk’s tweets about the meme coin in recent weeks and months. Notably, Dogecoin ascended past the $0.1589 mark in November 2022, following Musk’s acquisition of Twitter. Since then, however, DOGE has been on a pronounced downtrend.
The anticipation of Musk introducing Dogecoin as a payment method on Twitter remains palpable within the DOGE community. However, outside this sentiment is not shared, underscored by the stark decline in DOGE trading volume, suggesting a diminished presence of speculators and traders.
If Musk does integrate DOGE on Twitter, the price reaction is likely to be swift. But what is a good entry price?
Monthly Chart DOGE/USD
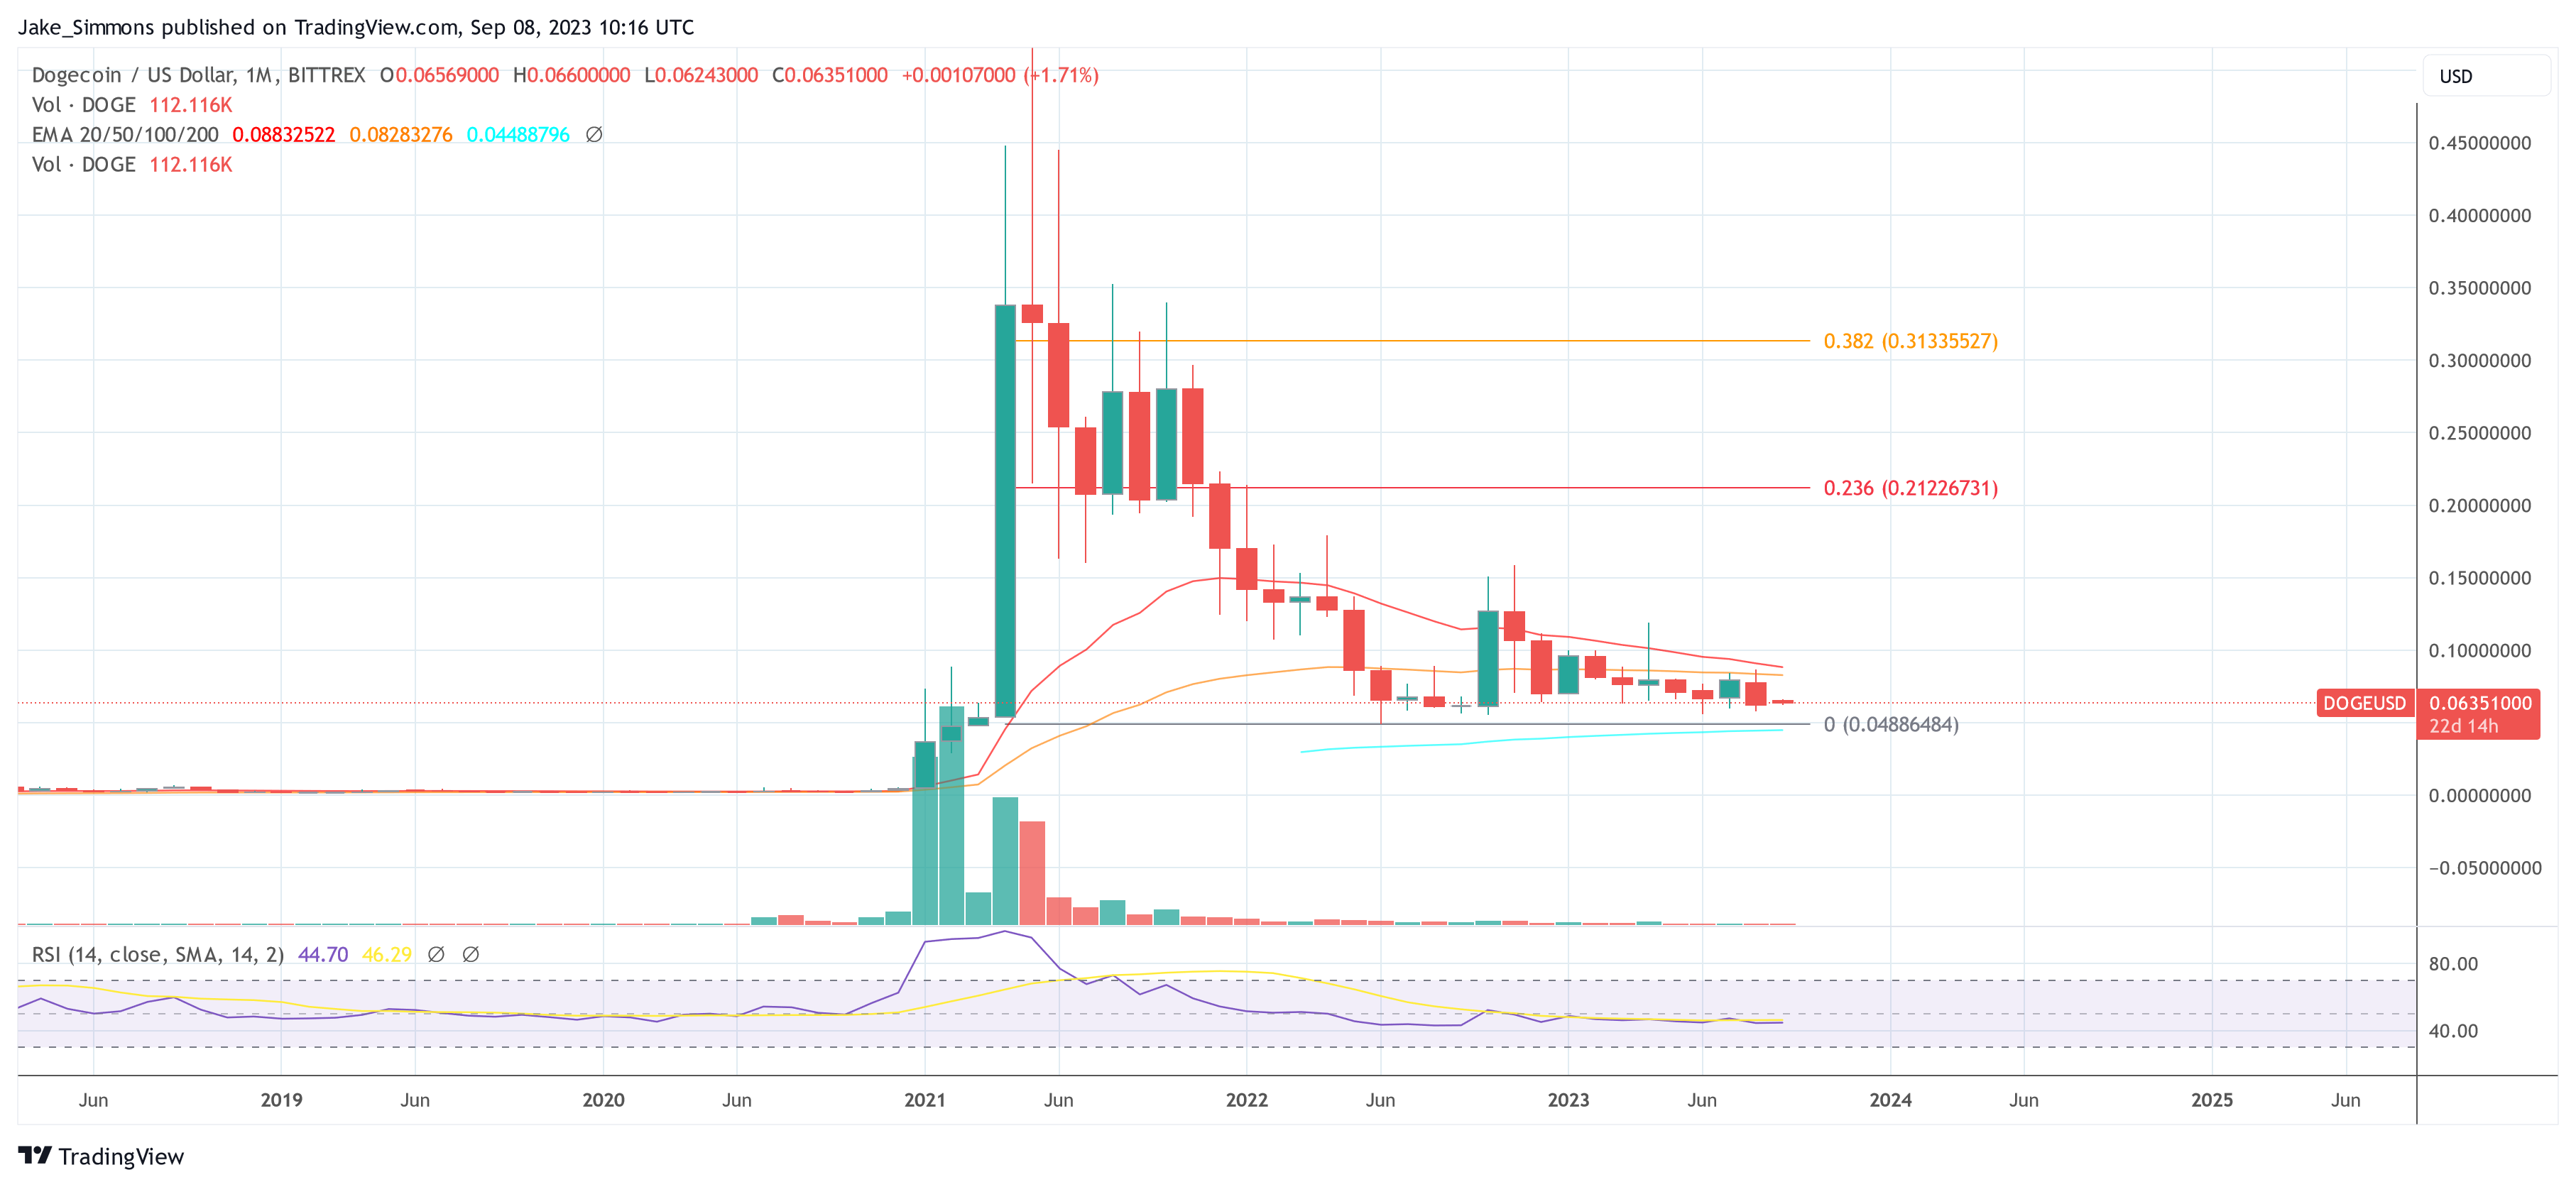
While many older altcoins are plumbing new lows, Dogecoin exhibits a more resilient sideways accumulation pattern on its monthly chart. This chart reveals that the $0.0480 mark is pivotal for Dogecoin. Should DOGE maintain its stance above this price, it could present a viable opportunity for long-term spot investors.
This price level is especially interesting as it coincides with the 100-week EMA at $0.04886. However, it’s imperative to acknowledge the inherent unpredictability associated with Dogecoin’s long-term trajectory, given its meme coin status.
Weekly Chart Dogecoin
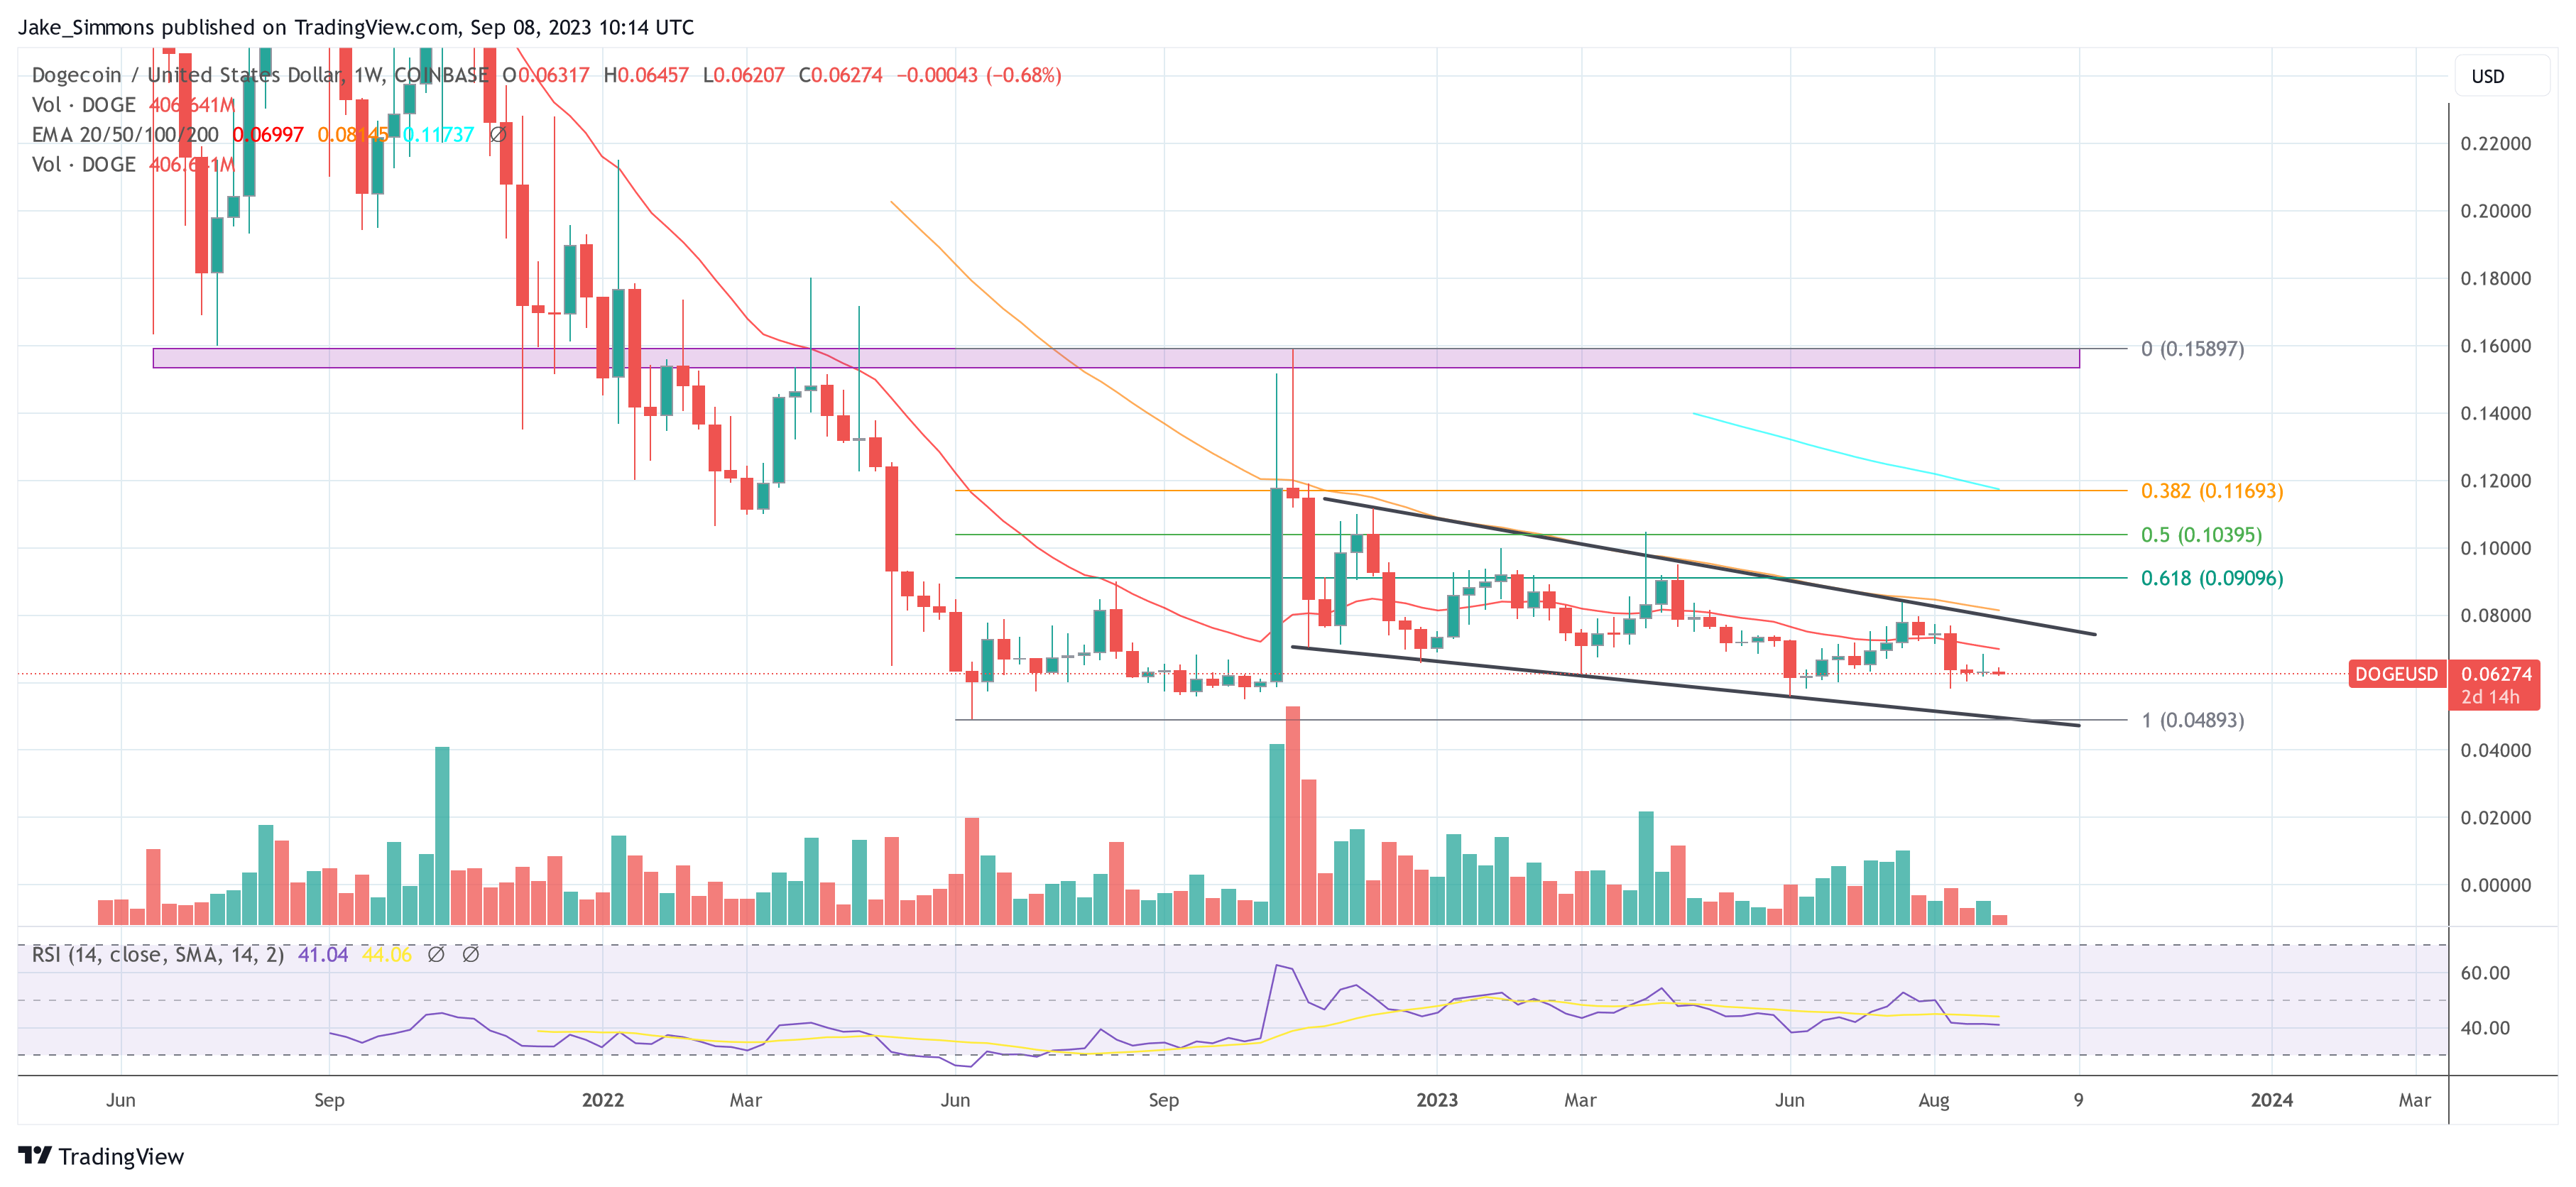
The 1-month chart delineates a clear downtrend. DOGE could fall towards the lower trendline at $0.0480 before another run towards the upper trendline at $0.075. Remarkably, the 30-month low of June 2022 is also located near the trend channel low at $0.0488.
If DOGE bounces up from here, the price would have to face the 61.8% Fibonacci retracement at $0.0909. A retest of the breakout from the downtrend could occur here. If the bulls succeed, the 50% Fibonacci retracement level at $0.1093 and the 38.2% Fibonacci retracement at $0.1169 could come into focus. The final target is the November 2022 high at $0.1589 where huge selling pressure is to be expected. At current price, DOGE would need to gain over 150% to reach this level.
Daily Chart DOGE/USD
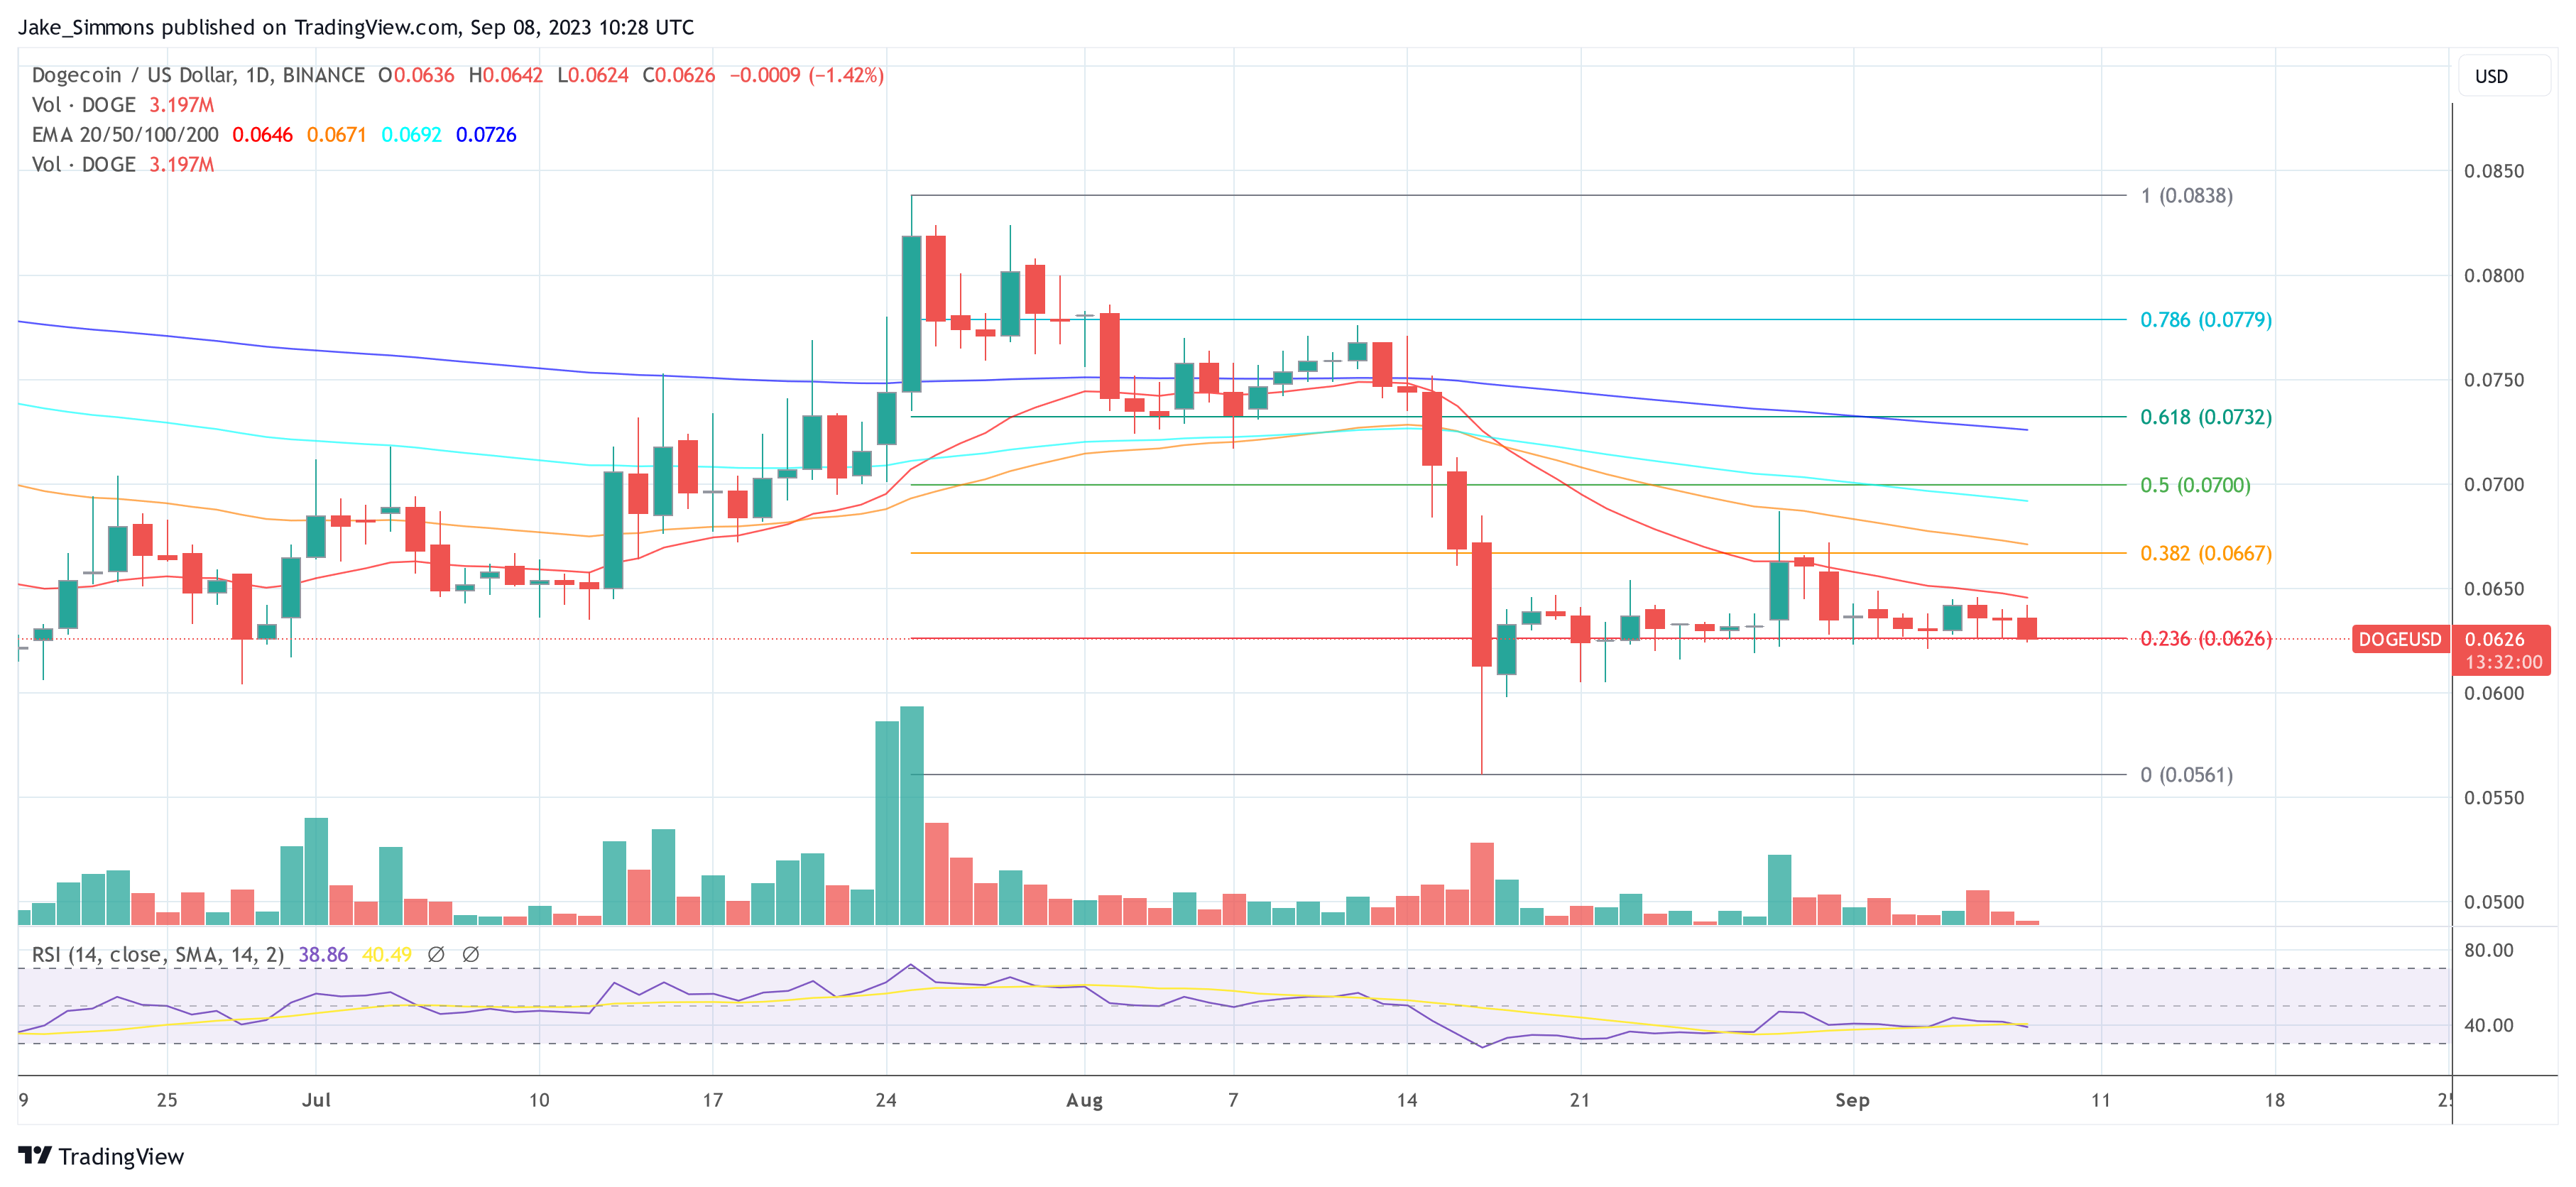
The 1-day chart underscores the persistent downtrend Dogecoin has been grappling with since December of the preceding year. This downtrend, demarcated by a descending trend channel, remains unbroken. Late in July, DOGE recoiled from the upper boundary of this channel, only to descend once more.
Alarmingly, pivotal support levels, inclusive of the 200-day EMA, have been compromised, hinting at a potential bearish trajectory. Current chart configurations suggest that DOGE might revisit its annual nadir at $0.05593 shortly. In a more bearish projection, a decline to the lower confines of the descending channel, oscillating between $0.05 and $0.048, is plausible.
Conversely, if DOGE steers clear of registering a new annual low, especially if the broader market sentiment experiences an upswing (perhaps due to the approval of a Bitcoin Spot ETF), the entry point for prospective investors might materialize sooner. For a substantial price resurgence, it’s imperative for DOGE to rebound from this potential new low with a robust buying volume, indicating renewed interest and liquidity for the meme coin.
Source: Read Full Article


