Ethereum Is In A Range While The Bears Are Winning Over The Bulls
Cryptocurrency analysts of Coinidol.com report, the Ethereum price (ETH) has remained steady due to the doji candlesticks.
Long-term analysis of the Ethereum price: bearish
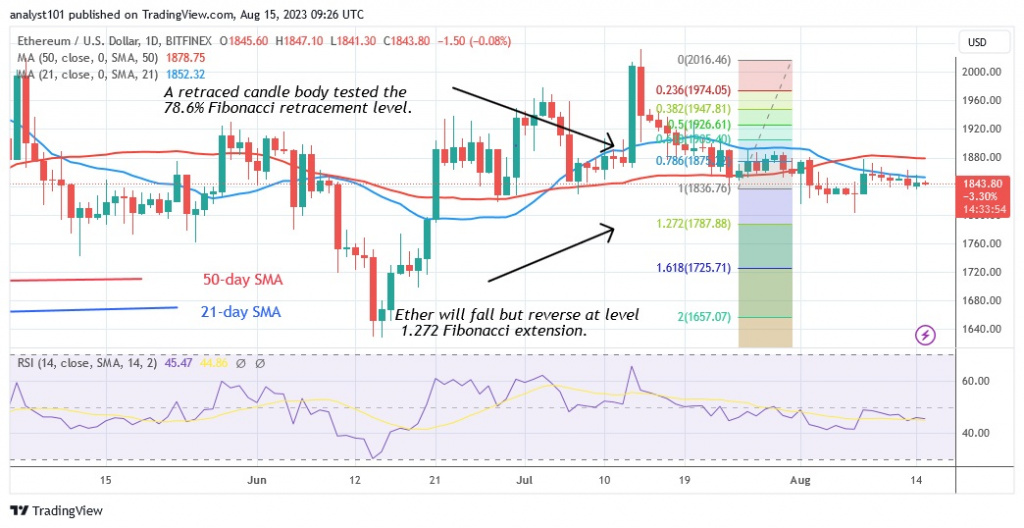
The most valuable altcoin is trading between $1,800 and $1,900. Ether is trading below the moving average lines but above the support level of $1,800. The altcoin is in danger of falling because it is below the moving average lines.
Since August 1, the cryptocurrency price has been above the support level of $1,800. The doji candlesticks have slowed down the price movement.
Both price increases and decreases seem doubtful. Ether is trading below the moving average lines, which gives the bears an advantage over the bulls.
Ethereum indicator analysis
While Ether is consolidating above $1,800, the Relative Strength Index is unchanged. The price bars are now below the moving average lines, indicating that the price is likely to fall. Ether is in a downtrend below the Stochastic daily level of 40. The decline has slowed as Ether consolidates above the current support level.
Technical Indicators:
Key resistance levels – $1,800 and $2,000
Key support levels – $1,600 and $1,400
What is the next direction for Ethereum?
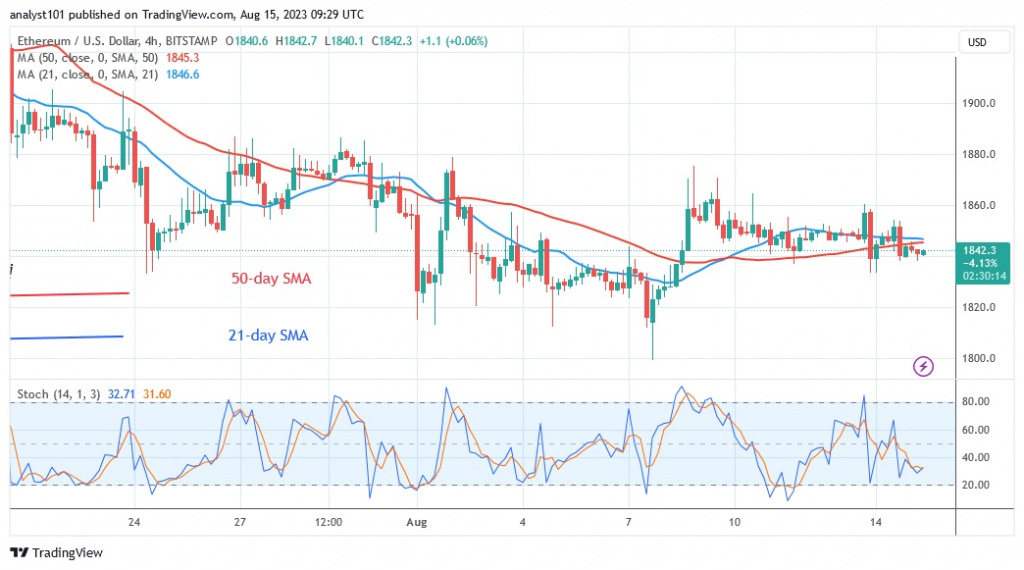
Ethereum’s sideways trend could continue as the altcoin trades in a range. In other words, as long as the boundaries of the trading range are not broken, the largest altcoin will continue its trend. On the 4-hour chart, Ether is trading between $1,820 and $1,880.
As we reported on August 12, the resistance of $1,870 has stopped the advance. The bulls were just building upward momentum before the denial.
Disclaimer. This analysis and forecast are the personal opinions of the author and are not a recommendation to buy or sell cryptocurrency and should not be viewed as an endorsement by CoinIdol.com. Readers should do their research before investing in funds.
Source: Read Full Article


