Polkadot Declines, Faces Stiff Resistance at the $34 Level
The price of Polkadot (DOT) has made impressive moves as the altcoin attempts to break above the $34 resistance zone. In the last 48 hours, buyers have retested the $34 level in an attempt to break it.
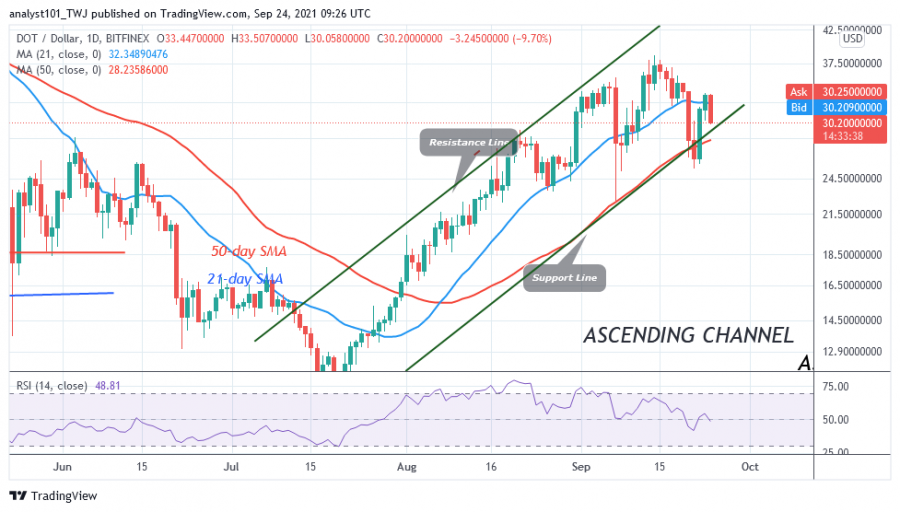
The market will rally above $38 if the current resistance level is broken. However, if it is rejected, DOT will fall and resume its downward movement. Meanwhile, DOT/USD has fallen sharply to a low of $30.50 at press time. Buyers could not sustain the bullish momentum above the $34 resistance level.
Polkadot indicator analysis
The DOT price has fallen between the 21-day and 50-day lines SMA. The altcoin will face selling pressure again if the price falls below the 50-day line SMA. DOT is at the 48 level of the Relative Strength Index for period 14, indicating that it is now in the downtrend zone and below the 50 midline. The altcoin is below the 80% range of the daily stochastic. This means that the cryptocurrency is now trading in the downtrend zone.
Technical indicators:
Major Resistance Levels – $48 and $52
Major Support Levels – $28 and $24
What is the next direction for Polkadot?
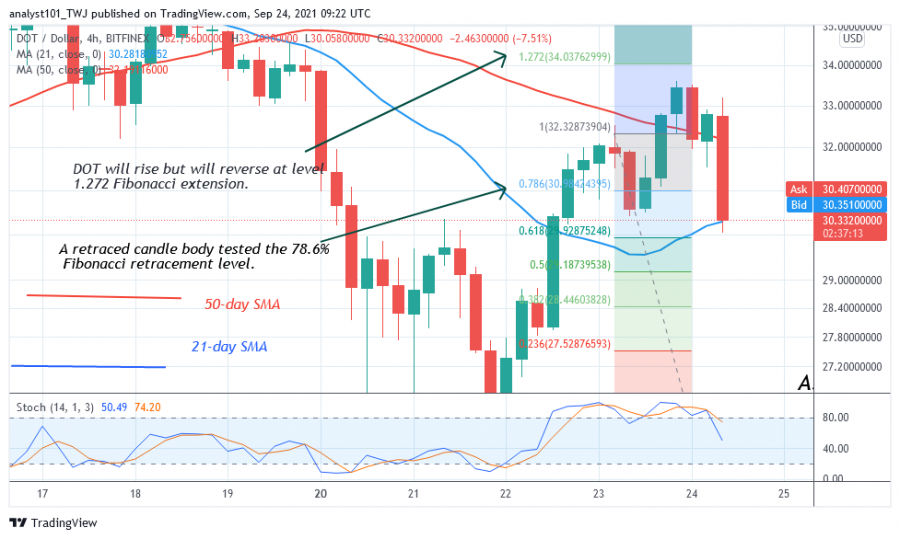
DOT/USD is in a downtrend. Yesterday, altcoin completed an impressive move as it retested resistance at $34. According to the Fibonacci tool, the current uptrend will end at the 1.272 Fibonacci extension or $34.03. The price action shows that Polkadot has resumed its downward movement. The altcoin has reversed at the $33.20 price instead of the $34 high.
Disclaimer. This analysis and forecast are the personal opinions of the author and are not a recommendation to buy or sell cryptocurrency and should not be viewed as an endorsement by CoinIdol. Readers should do their research before investing funds.
Source: Read Full Article


