Polkadot is in a Tight Range between $17 and $20 as Bulls Targets the $25 High
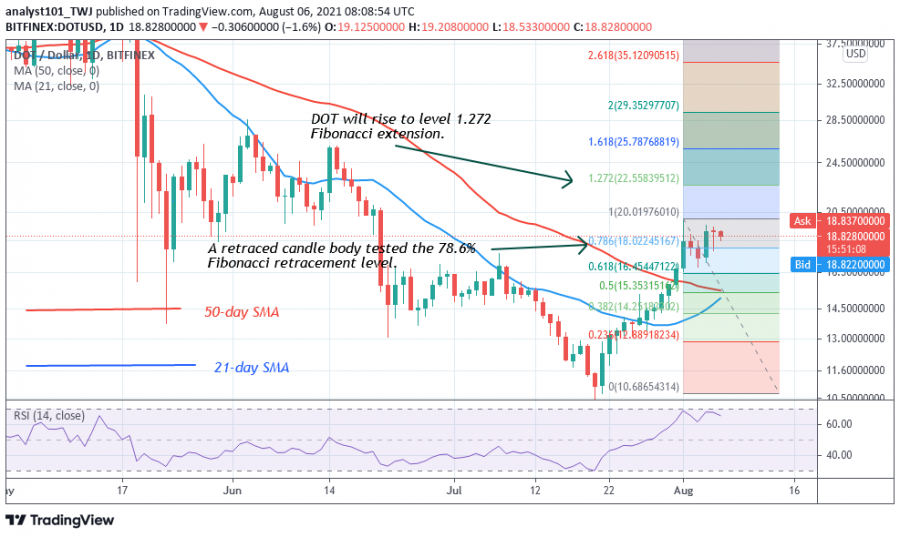
The price of Polkadot (DOT) has made impressive moves as the altcoin breaks above the moving averages. Today, DOT /USD was forced to move sideways below resistance at $20. The altcoin has been fluctuating between $17 and $20 since August 1.
On the upside, a break above the $20 resistance will catapult the altcoin to a high of $22 or $25. On the other hand, if the $20 resistance remains unbroken, the market will continue to trade in a range-bound move. In the meantime, Polkadot’s upside is doubtful as the market approaches the oversold region. The altcoin is trading at $19.06 at the time of writing.
Polkadot indicator analysis
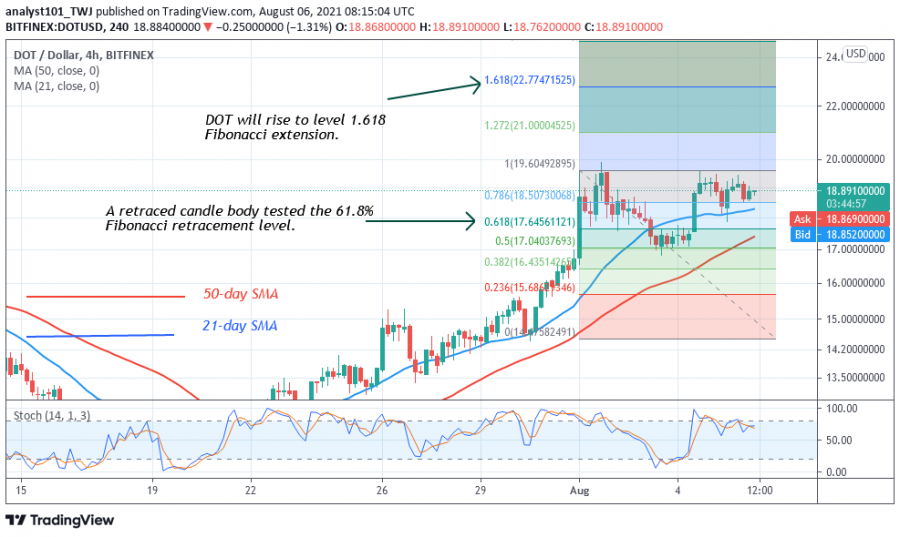
DOT price bars are above the moving averages, suggesting that the cryptocurrency will rise. Polkadot is at the 67 level of the Relative Strength Index for period 14, suggesting that the altcoin does not have enough room to move up. The cryptocurrency is above the 80% area of the daily stochastic. This means that the market is in an overbought zone.
Technical indicators:
Major Resistance Levels – $48 and $52
Major Support Levels – $18 and $12
What is the next direction for Polkadot?
Polkadot is in an uptrend. The upward movement is likely as the altcoin reaches the bullish trend zone. The cryptocurrency will continue to rise as long as the price bars are above the moving averages. Meanwhile, on the August 1 uptrend, a retraced candle body tested the 61.8% Fibonacci retracement level. The retracement suggests that the price of DOT will rise to the level of 1.618 Fibonacci extensions, or to the level of $22.77.
Disclaimer. This analysis and forecast are the personal opinions of the author and are not a recommendation to buy or sell cryptocurrency and should not be viewed as an endorsement by CoinIdol. Readers should do their research before investing funds.
Source: Read Full Article


