Polkadot Reaches Bearish Exhaustion, Consolidates Above $39 Support
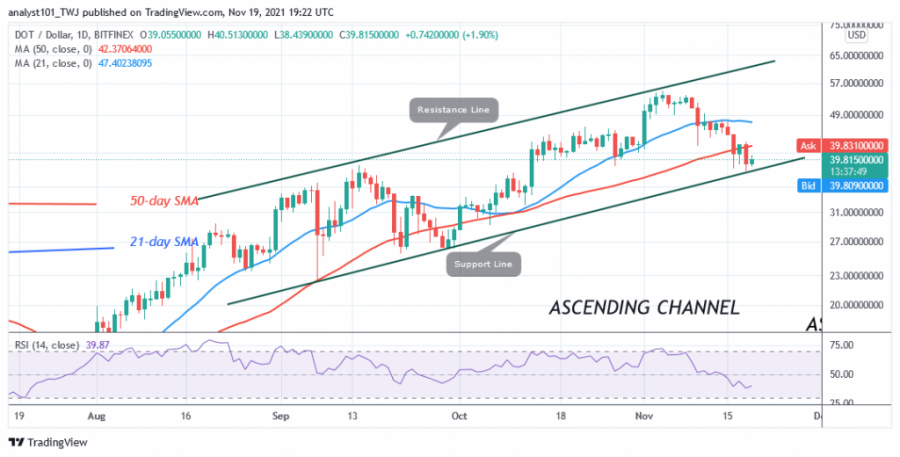
Today, the price of Polkadot (DOT) fell to the low of $37 after falling below the moving averages. If the price breaks below the moving averages, there is a tendency for the price to move down further.
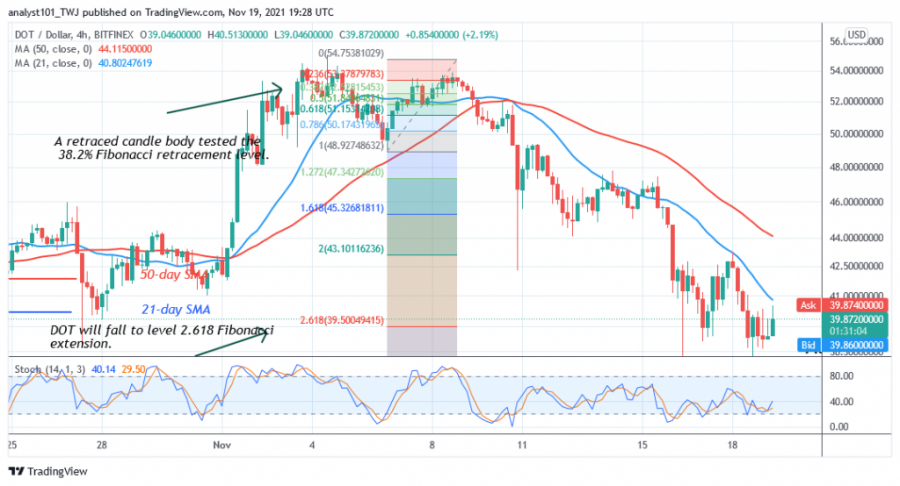
According to the stochastic on the daily chart, the price of DOT has fallen into the oversold zone. The current downtrend is likely to subside once the market reaches the oversold area. Bullish candlesticks are above the current support, indicating a possible uptrend. DOT will rise when the price rises back above the current support. In the meantime, the cryptocurrency is trading just above the current support.
Polkadot indicator analysis
The price of DOT has fallen to the 39 level of the Relative Strength Index of period 14. Polkadot is in a downtrend and is approaching the oversold zone. The altcoin has the tendency to fall. The cryptocurrency value is above the 25% area of the daily stochastic. Polkadot previously fell into the oversold area, but is now rising. Buyers are expected to show up in the oversold region.
Technical indicators:
Major Resistance Levels – $52 and $56
Major Support Levels – $28 and $24
What is the next direction for Polkadot?
DOT/USD has been in a downtrend, but selling pressure has reached bearish exhaustion. Meanwhile, on November 6, the downturn has seen a retracement candlestick testing the 38.2% Fibonacci retracement level. The retracement suggests that the price of DOT will fall to the 2.618 Fibonacci Extension level or $39.50. The price action shows that the price of DOT fell to a low of $37 and recovered above $39. The altcoin is now consolidating above the Fibonacci extension.
Disclaimer. This analysis and forecast are the personal opinions of the author and are not a recommendation to buy or sell cryptocurrency and should not be viewed as an endorsement by CoinIdol. Readers should do their research before investing funds.
Source: Read Full Article


