Polkadot Returns from the Overbought Region as Bulls Fail to Break the High of $15.24
Polkadot price (DOT) has reached a high of $15.54 as it moves in the uptrend.
Polkadot (DOT) Price Long-Term Analysis: Bearish
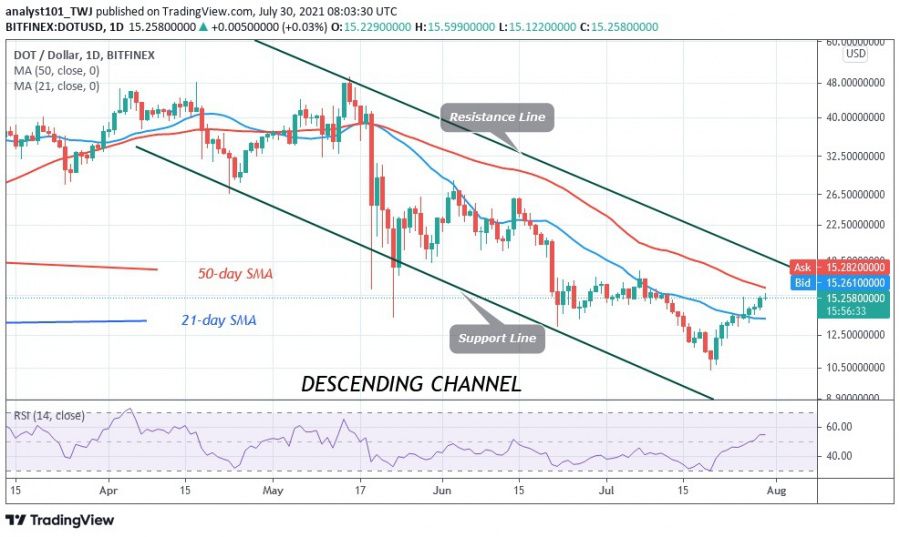
Today it retraced to support above the 21-day line SMA. Polkadot price seems to be forming a series of higher highs and higher lows. The higher lows are testing the 21-day line SMA, which is pushing the price up. The bulls broke through resistance at $15.24 as the altcoin hit a high of $15.54. Currently, the altcoin is falling back from recent highs.
The retracement has broken below the previous support of $15.24. This means that selling pressure on the downside could pick up again. If buyers break the $15.24 high, the market could go as high as $17. On the other hand, if DOT/USD meets with rejection, DOT will continue to fluctuate between $13 and $15.24.
Polkadot (DOT) Indicator Analysis
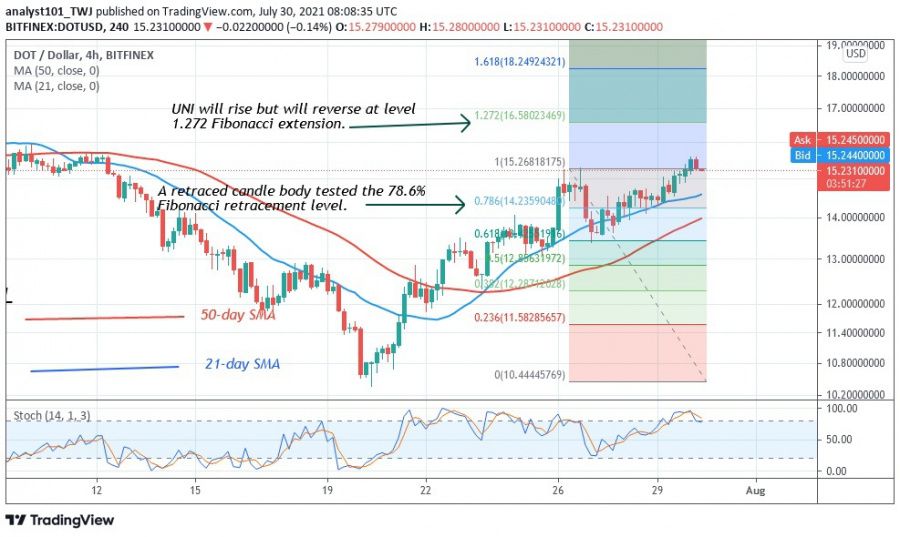
Polkadot is at the 50 level of the Relative Strength Index for period 14, indicating that there is a balance between supply and demand. The DOT price is still above the 80% range of the daily stochastic. The cryptocurrency is in the overbought region of the market. As a result, Polkadot is capable of falling into the downtrend zone.
Technical indicators:
Major Resistance Levels – $48 and $52
Major Support Levels – $18 and $12
What Is the Next Direction for Polkadot (DOT)?
Polkadot could continue its uptrend if the price breaks above the resistance at $15.24. Meanwhile, on July 26 uptrend; a retraced candlestick body tested the 78.6% Fibonacci retracement level. The retracement suggests that the price of DOT will rise but reverse at 1.272 Fibonacci extensions or at $16.58.
Disclaimer. This analysis and forecast are the personal opinions of the author are not a recommendation to buy or sell cryptocurrency and should not be viewed as an endorsement by CoinIdol. Readers should do their research before investing funds.
Source: Read Full Article


