Binance Coin Faces Rejection at $280 and Targets Low of $245
The price of Binance Coin (BNB) is in a downtrend as the price breaks below the moving average lines.
Binance Coin price long term forecast: bearish
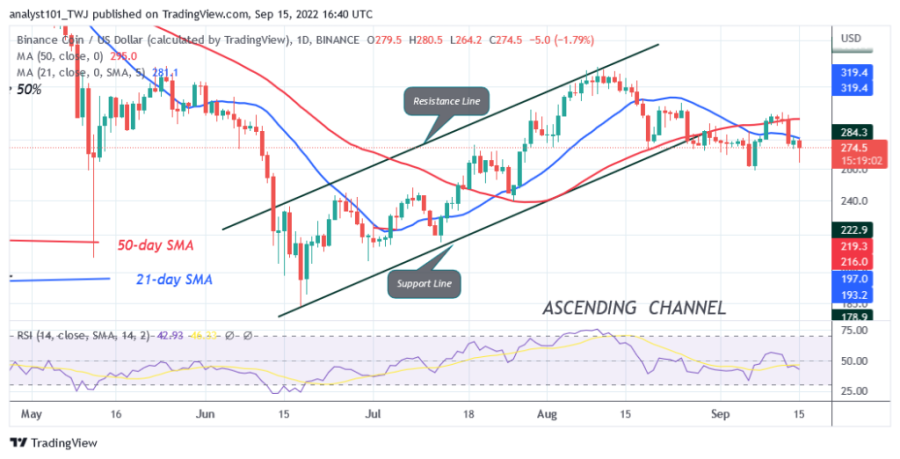
On September 13, the bulls broke through the moving average lines but were rejected at the $300 resistance level. BNB has fallen below the moving average lines and further upside is being resisted by the 21-day line SMA. Since August 20, buyers have failed to keep BNB above the $300 resistance level. On the downside, BNB will fall back to the $240 and $245 lows if it turns down from the moving average lines. Today, BNB is trading above the $275 support. A bounce above current support will break through resistance and cause a rally to the $322 high.
Binance Coin indicator display

BNB is at level 43 on the Relative Strength Index for period 14. The cryptocurrency is in a downtrend and could continue to fall. The price bars are below the moving average lines, indicating a further decline. BNB is below the 50% area of the daily stochastic. This indicates that the market is in a bearish momentum. The 21-day line SMA and the 50-day line SMA are down, indicating a downtrend.
Technical Indicators:
Key resistance levels – $600, $650, $700
Key support levels – $300, $250, $200
What is the next direction for BNB/USD?
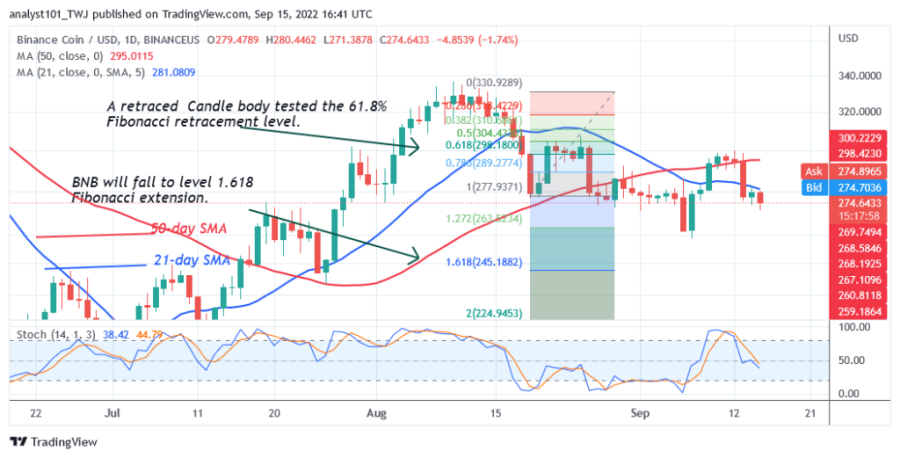
Today, Binance Coin is facing a rejection at the 21-day line SMA. Selling pressure could continue if the price breaks the current support at $261. Meanwhile, the August 19 downtrend has shown a candlestick body testing the 61.8% Fibonacci retracement level. The retracement suggests that BNB will fall to the 1.618 Fibonacci extension level or $245.18.
Disclaimer. This analysis and forecast are the personal opinions of the author and are not a recommendation to buy or sell cryptocurrency and should not be viewed as an endorsement by CoinIdol. Readers should do their research before investing in funds.
Source: Read Full Article