Binance Coin is in a Brief Uptrend, Faces Strong Rejection at the $385 Resistance
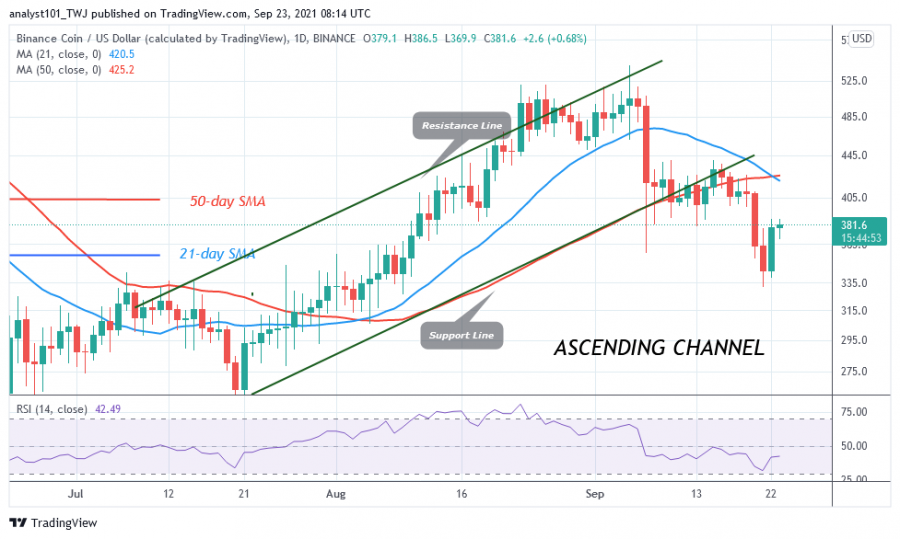
Binance Coin (BNB) price has risen and reached a high of $386.50. It rose from the previous low of $332.50. Today, the uptrend is facing resistance from the recent high.
The market is pulling back as the price has reached an overbought area. Sellers may try to push the cryptocurrency to the previous low at $340. If sellers break the previous low at $340, the cryptocurrency will continue to fall to the low at $285. If the current support holds, BNB/USD will be forced to trade range bound above the $340 support. In other words, the market will start a new uptrend. Currently, the altcoin is falling back to the previous low at $340.
Binance Coin indicator reading

Binance Coin price shows a bearish crossover as the 21-day line SMA crosses the 50-day line SMA. This indicates a sell signal. BNB is at level 41 of the Relative Strength Index of period 14, indicating that the market is in the downtrend zone and below the centre line 50. The cryptocurrency is still above the 80% range of the daily stochastic. There is a possibility of further downward price movement.
Technical indicators:
Major Resistance Levels – $700 and $750
Major Support Levels – $400 and $350
What is the next direction for BNB/USD?
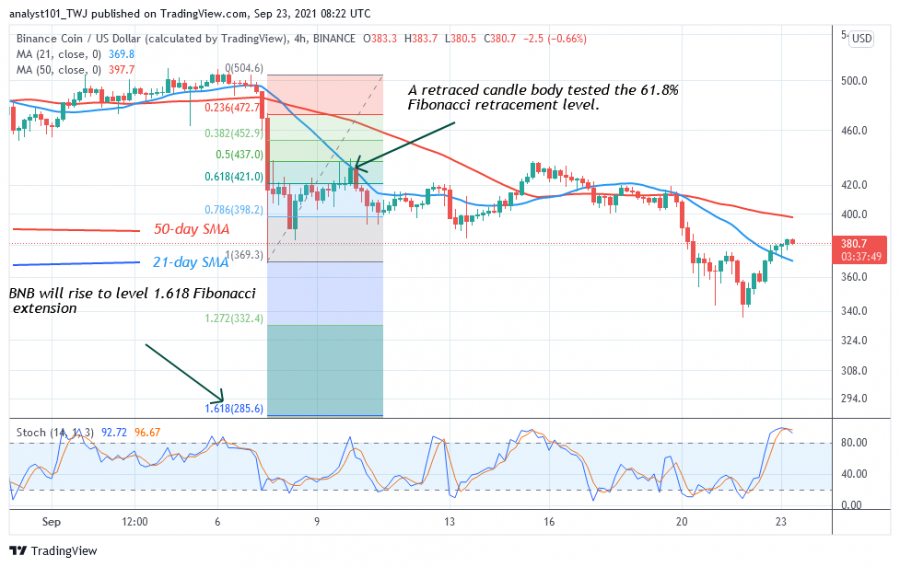
Binance Coin has resumed its downward movement as it meets resistance from the high at $385. If the bears break the support at $340, the Fibonacci tool analysis will kick in. Meanwhile, the September 7 downtrend has shown a candlestick testing the 61.8% Fibonacci retracement level. The retracement suggests that BNB will fall to the 1.618 Fibonacci Extension level or $285.60.
Disclaimer. This analysis and forecast are the personal opinions of the author and are not a recommendation to buy or sell cryptocurrency and should not be viewed as an endorsement by CoinIdol. Readers should do their own research before investing funds.
Source: Read Full Article