
Bitcoin Bulls Keeps Pushing, Why Fresh Increase To $31K Seems Likely
Bitcoin price is attempting a fresh increase from $29,500. BTC could gain bullish momentum if it clears the $30,200 resistance zone in the near term.
- Bitcoin is slowly moving higher from the $29,500 level.
- The price is trading below $30,200 and the 100 hourly Simple moving average.
- There is a major bearish trend line forming with resistance near $30,100 on the hourly chart of the BTC/USD pair (data feed from Kraken).
- The pair could start a decent increase if there is a close above the $30,200 resistance.
Bitcoin Price Aims Higher
Bitcoin price followed a bearish path below the $30,200 pivot level. BTC even broke the $29,850 level and tested the $29,500 level. A low is formed near $29,500 and the price is now attempting a fresh increase.
The price climbed above the $29,850 and $30,000 resistance levels. There was a move above the 50% Fib retracement level of the downward move from the $30,448 swing high to the $29,500 low. The price is now consolidating near $30,000.
Bitcoin price is still trading below $30,200 and the 100 hourly Simple moving average. Immediate resistance is near the $30,080 level. There is also a major bearish trend line forming with resistance near $30,100 on the hourly chart of the BTC/USD pair.
The trend line is near the 61.8% Fib retracement level of the downward move from the $30,448 swing high to the $29,500 low. The first major resistance is near $30,200. A close above the $30,200 level might start a fresh increase.
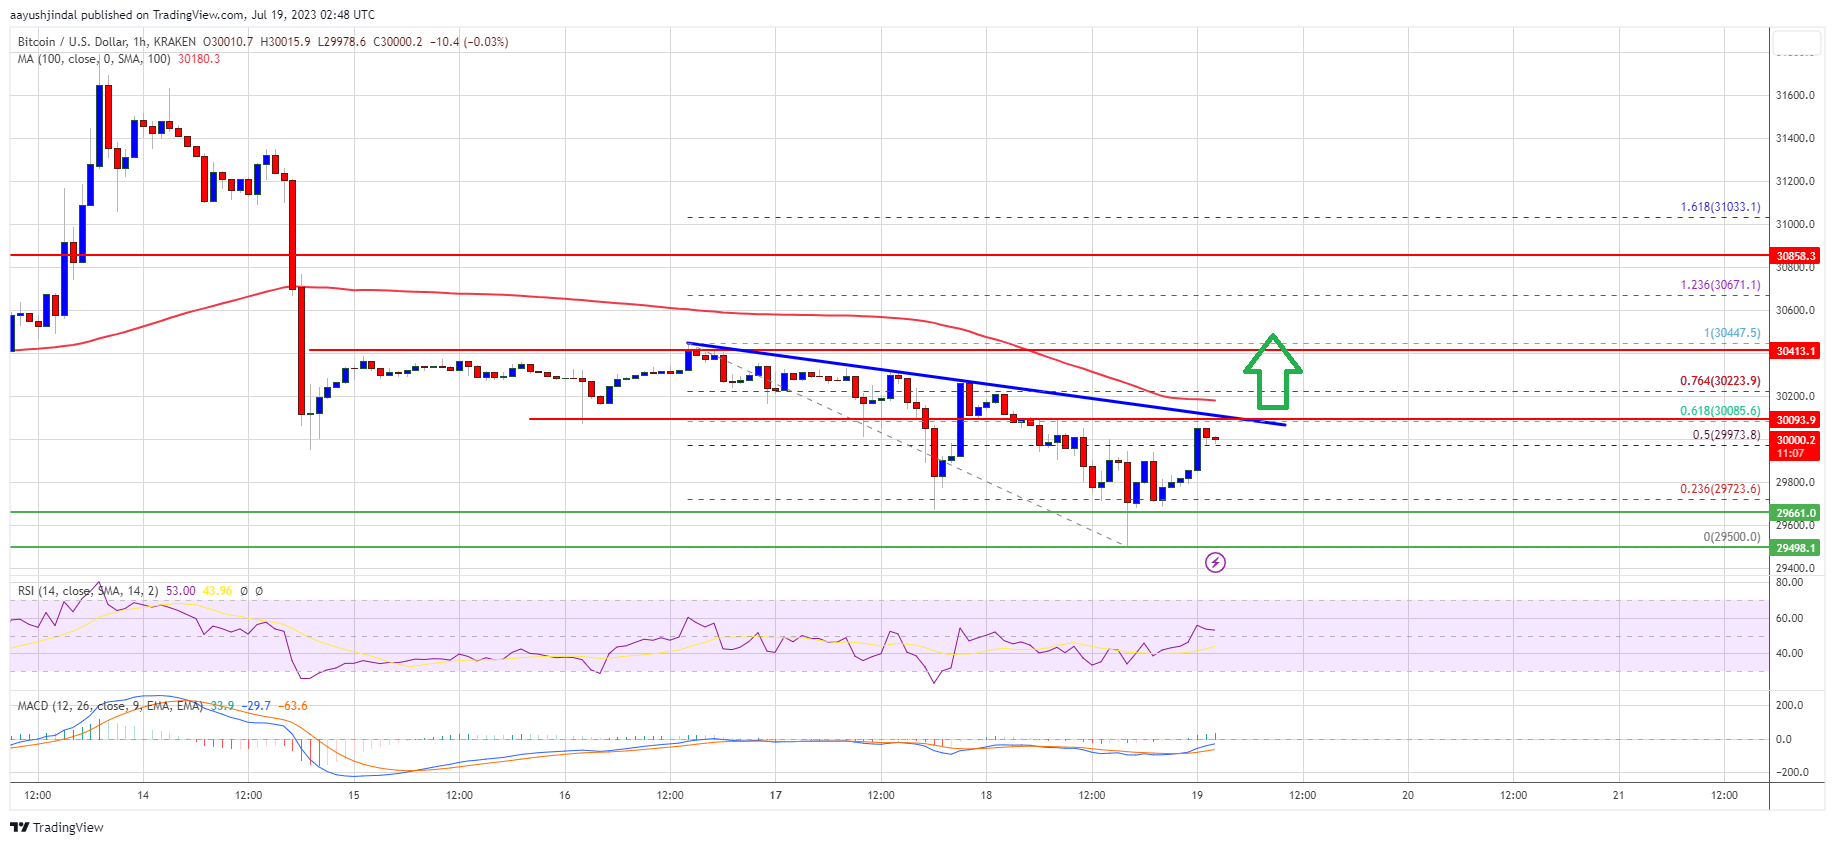
Source: BTCUSD on TradingView.com
The next major resistance is near the $30,500 level. Any more gains could open the doors for a move toward the $31,000 resistance zone.
More Losses in BTC?
If Bitcoin fails to clear the $30,200 resistance, it could continue to move down. Immediate support on the downside is near the $29,650 level.
The next major support is near the $29,500 level, below which the price could gain bearish momentum. In the stated case, the price could drop toward the $29,200 support zone. Any more losses might send the price toward the $28,750 level in the near term.
Technical indicators:
Hourly MACD – The MACD is now gaining pace in the bullish zone.
Hourly RSI (Relative Strength Index) – The RSI for BTC/USD is now above the 50 level.
Major Support Levels – $29,650, followed by $29,200.
Major Resistance Levels – $30,100, $30,200, and $30,500.
Source: Read Full Article