
Bitcoin Price Holds Strong As The Bulls Aim New High Above $32K
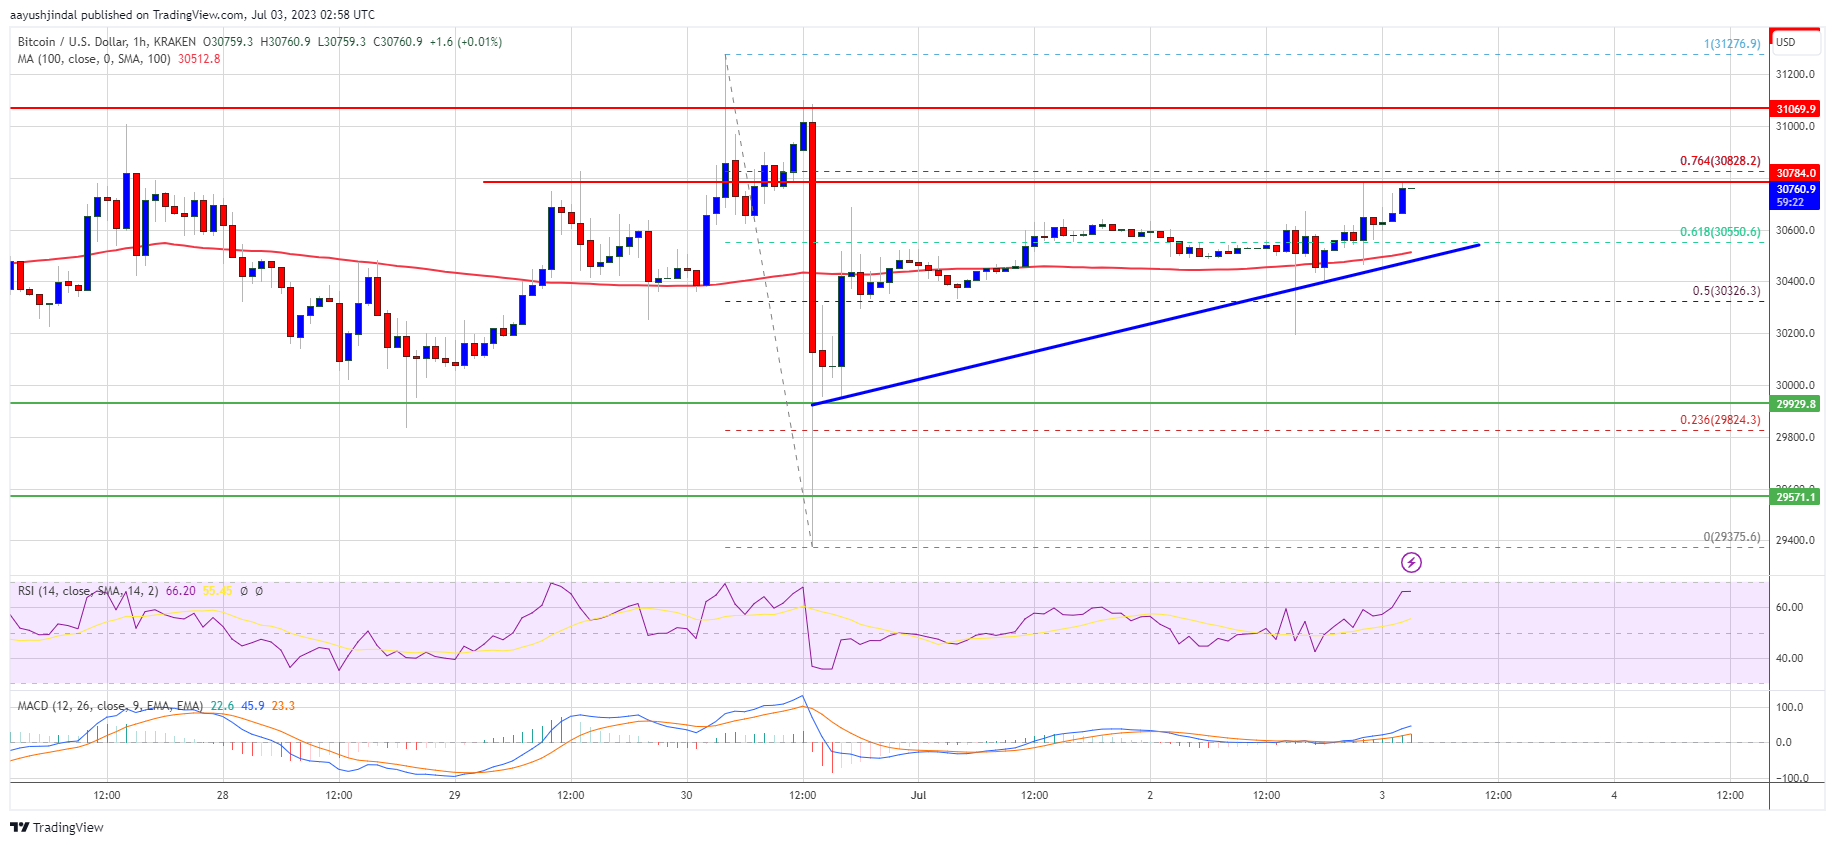
Bitcoin price is moving higher above the $30,500 resistance. BTC is showing positive signs and might aim for a new high above the $31,400 level.
- Bitcoin is trimming all its losses and trading above the $30,500 resistance zone.
- The price is trading above $30,500 and the 100 hourly Simple moving average.
- There is a key bullish trend line forming with support near $30,500 on the hourly chart of the BTC/USD pair (data feed from Kraken).
- The pair could gain bullish momentum if it clears the $31,000 resistance zone.
Bitcoin Price Regains Strength
Bitcoin price declined heavily below the $30,500 support. BTC even spiked below $29,500 before the bulls appeared. A low is formed near $29,375 and the price is now rising.
It is back above the $30,200 resistance level. There was a break above the 50% Fib retracement level of the downward move from the $31,276 swing high to the $29,375 low. There was also a move above the $30,500 resistance zone.
Bitcoin is trading above $30,500 and the 100 hourly Simple moving average. There is also a key bullish trend line forming with support near $30,500 on the hourly chart of the BTC/USD pair.
Immediate resistance is near the $30,820 level. It is close to the 76.4% Fib retracement level of the downward move from the $31,276 swing high to the $29,375 low. The first major resistance is near the $31,000 level, above which the price gain bullish momentum.
Source: BTCUSD on TradingView.com
The next major resistance is near the $31,250 level. An upside break above the $31,250 resistance might send BTC toward $32,000. Any more gains could open the doors for a move toward the $32,500 resistance zone.
Fresh Decline in BTC?
If Bitcoin’s price fails to clear the $30,820 resistance, it could start another decline. Immediate support on the downside is near the $30,550 level and the trend line.
The next major support is near the $30,200 level, below which there could be a drop toward the $29,950 support. Any more losses might send the price toward the $29,550 zone in the near term.
Technical indicators:
Hourly MACD – The MACD is now gaining pace in the bullish zone.
Hourly RSI (Relative Strength Index) – The RSI for BTC/USD is above the 50 level.
Major Support Levels – $30,500, followed by $30,200.
Major Resistance Levels – $30,820, $31,000, and $31,250.
Source: Read Full Article