Bitcoin Surge Isn’t Over Yet, Why BTC Could Hit $34K Soon
Bitcoin price remained in a bullish zone and climbed above $30,000 against the US Dollar. BTC corrected lower after reaching a new all-time high, but it is likely to continue higher towards $34,000.
- Bitcoin is up 12% and it is trading well above the $30,000 resistance zone.
- The price is showing a lot of positive signs above $31,000 and the 100 simple moving average (4-hours).
- There is a major bullish trend line forming with support near $30,800 on the 4-hours chart of the BTC/USD pair (data feed from Kraken).
- The pair is likely to continue higher towards the $34,000 and $35,000 levels in the near term.
Bitcoin Price Sets New ATH
In the past few days, there was a strong increase in bitcoin price above the $25,000 resistance against the US Dollar. The BTC/USD pair broke many major barriers near $28,000 and $30,000 to continue higher.

The bulls even pushed the price above the $32,000 level and BTC traded to a new all-time high near $33,300. Recently, there was a sharp downside correction below the $32,000 level. The price even spiked below the $31,000 level, but it stayed above the $30,000 support.
A low is formed near $30,316 and it started a fresh increase. There was a break above the $31,000 resistance zone. The bulls were able to push the price above the 50% Fib retracement level of the recent decline from the $33,298 high to $30,316 low.
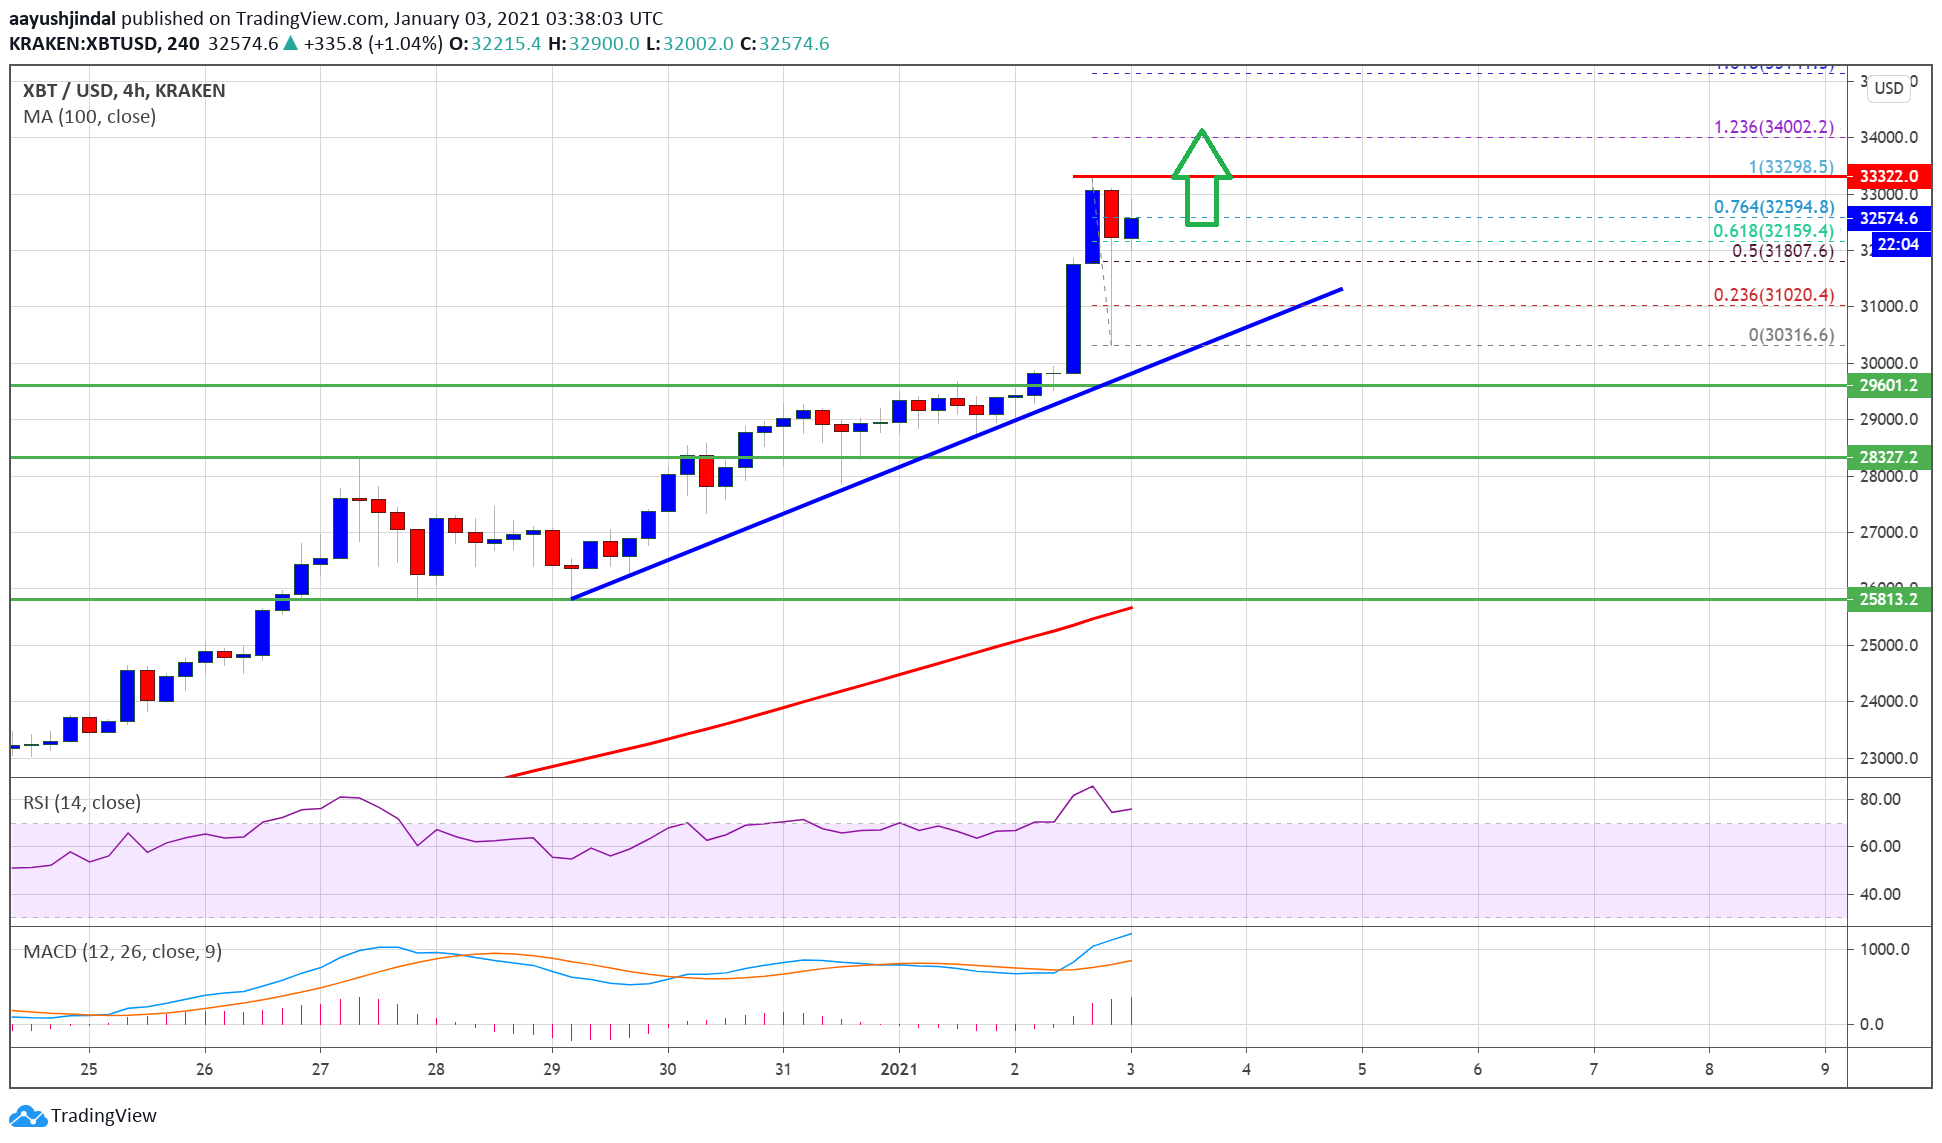
It is now trading nicely above the $32,000 resistance zone. There was a also a break above the 76.4% Fib retracement level of the recent decline from the $33,298 high to $30,316 low.
It seems like bitcoin price may soon clear the $33,298 high and trade to a new all-time high. The next key resistance could be near the $34,000 level. It is close to the 1.236 Fib extension level of the recent decline from the $33,298 high to $30,316 low.
Dips Supported in BTC?
If there is a fresh downside correction, bitcoin price might find bids near the $32,000 and $31,500 levels. There is also a major bullish trend line forming with support near $30,800 on the 4-hours chart of the BTC/USD pair.
The main support is now forming near the $30,000 level. A close below the $30,000 level might call for an extended decline towards the $28,500 level.
Technical indicators
4 hours MACD – The MACD for BTC/USD is gaining momentum in the bullish zone.
4 hours RSI (Relative Strength Index) – The RSI for BTC/USD is now well above the 60 level.
Major Support Level – $30,800
Major Resistance Level – $40,000
Source: Read Full Article