Chainlink's Network is Growing at a Rate of 12% Per Month – Analyst
LINK’s New All-time High Was Expected and a Sign of More Growth
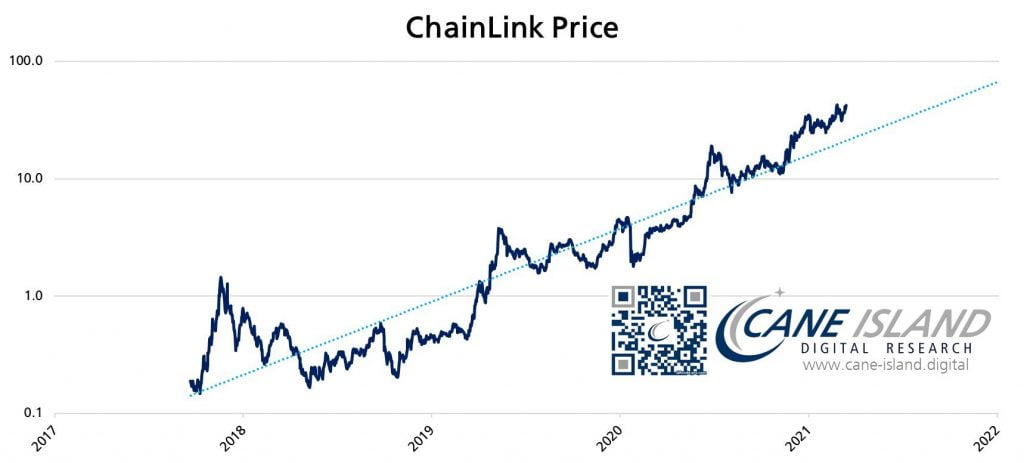
On numerous occasions, Mr. Peterson has pointed out that the price of LINK is related to the number of function calls on the Chainlink network. This relationship is at the core of his Metcalfe model of analyzing Chainlink which he has simplified using the following chart.
From the chart, it can be observed that the price of Chainlink (LINK) is following the Metcalfe value marked by the dotted blue line. In addition, Chainlink’s most recent all-time high of $51.20 is within an acceptable deviation from its Metcalfe value. Also from the chart, the same Metcalfe value hints that Chainlink could eventually hit $100 by the year 2022.
Short-term, A Pullback is Brewing for Chainlink (LINK)
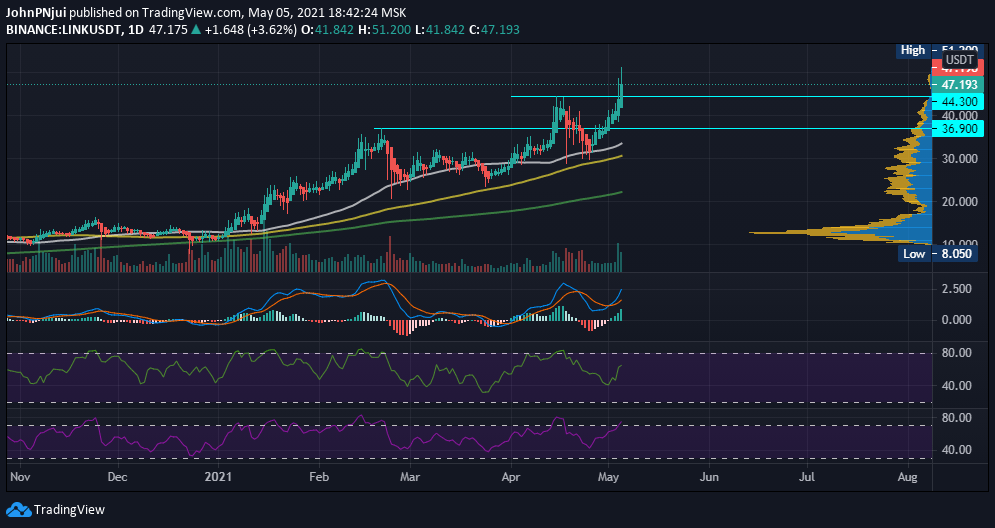
From a technical analysis point of view, the daily LINK/USDT chart below hints of an almost overbought situation for Chainlink.
To begin with, the daily MACD is clearly in bullish territory and is yet to show signs of weakness. The daily trade volume is still in the green with the daily MFI yet to be overbought at a value of 63. However, the daily RSI has crossed into overbought territory at a value of 74. Therefore, a pullback could be brewing for Chainlink in the hours and days to follow.
In terms of macro support zones, previous all-time highs of $44.30 and $36.90 are areas of interest moving forward.
Source: Read Full Article


