Charted: Cardano (ADA) Holds Key Support, Why It Could Rally Above $1.22
Cardano’s price recovered sharply from the $1.050 support zone. ADA is likely to continue higher if it clears the main $1.220 resistance zone in the near term.
- ADA is showing a lot of positive signs above the $1.150 pivot level against the US dollar.
- The price is trading nicely above $1.165 and the 100 simple moving average (4-hours).
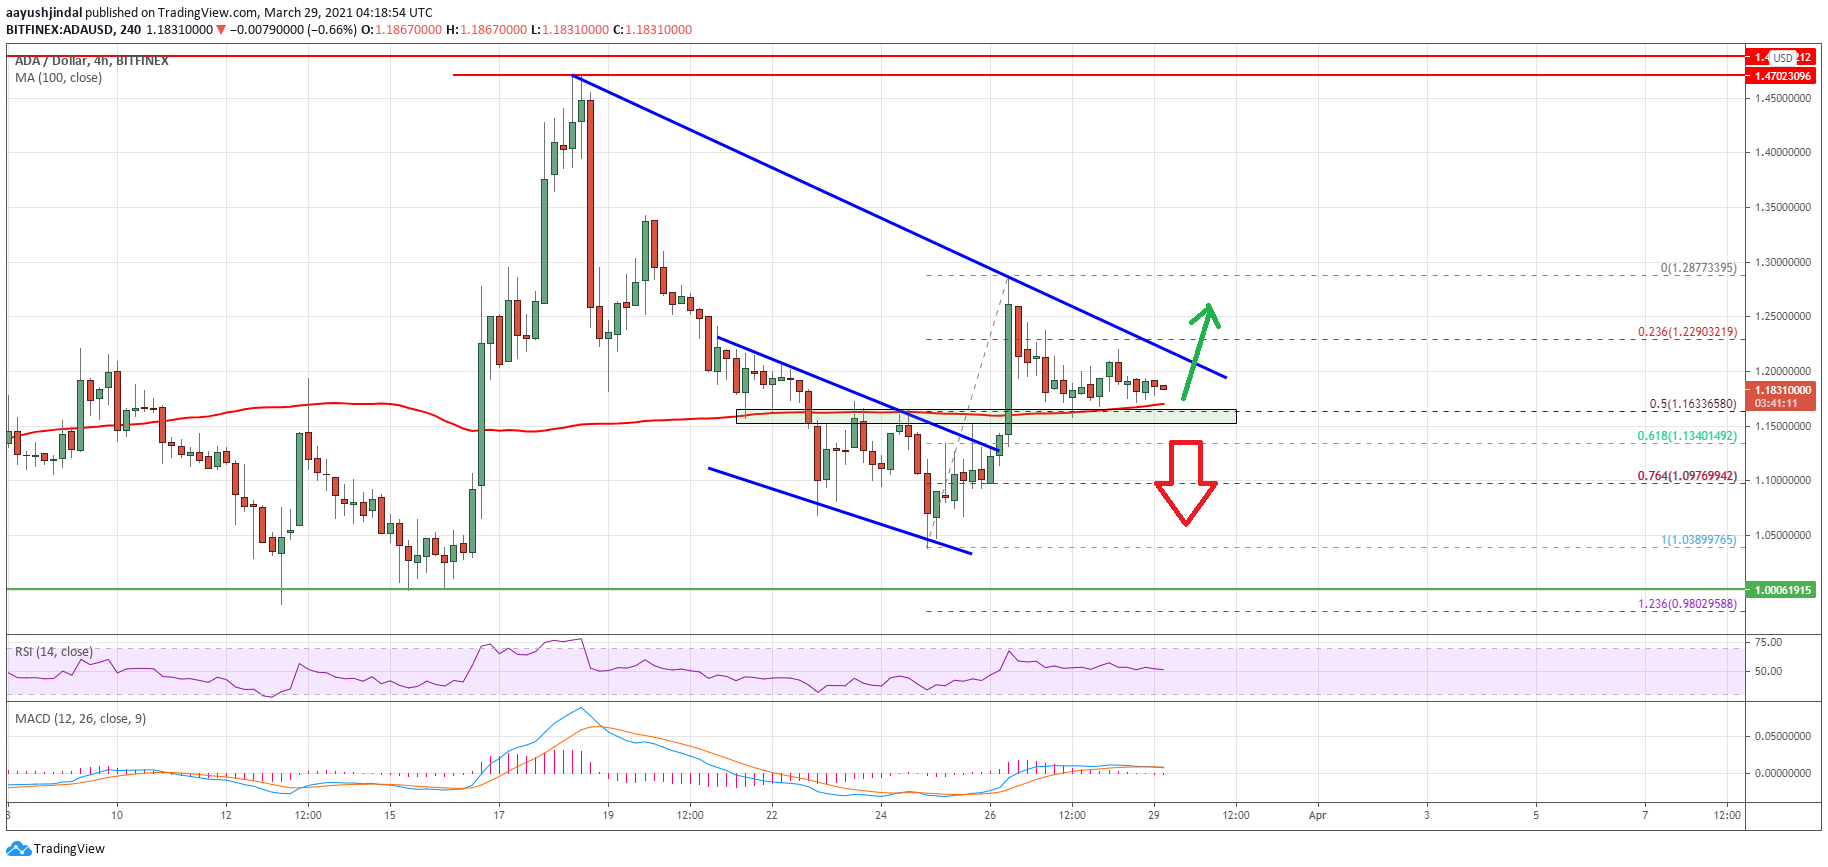
- There is a key bearish trend line forming with resistance near $1.218 on the 4-hours chart of the ADA/USD pair (data source from Bitfinex).
- The pair is likely to start a strong increase if there is a clear break above $1.220.
Cardano (ADA) is Holding Gains
After a steady decline, cardano’s price remained stable above $1.000. ADA price traded as low as $1.038 before it started an upside correction. There was a decent increase above the $1.080 and $1.110 resistance levels.
The price even surged above the $1.150 level and the 100 simple moving average (4-hours). The bulls pushed the price above the $1.220 resistance. A high was formed near $1.287 and the price is currently correcting lower.
There was a break below the $1.220 and $1.200 support levels. ADA even traded below the 23.6% Fib retracement level of the upward move from the $1.038 swing low to $1.287 high. It is now trading nicely above $1.165 and the 100 simple moving average (4-hours).
Source: ADAUSD on TradingView.com
It seems like there is a major support forming near $1.165. The 50% Fib retracement level of the upward move from the $1.038 swing low to $1.287 high is also near $1.165. Besides, there is a key bearish trend line forming with resistance near $1.218 on the 4-hours chart of the ADA/USD pair.
If there is an upside break above the $1.200 and $1.220 resistance levels, the price could start a strong increase. In the stated case, the price could rise steadily towards the $1.280 and $1.335 levels.
Fresh Decrease?
If cardano’s price fails to clear the $1.200 and $1.220 resistance levels, it could start a fresh decline. The key breakdown support is forming near the $1.165 and $1.150 levels.
A downside break below the $1.150 level could open the doors for a fresh decline towards $1.050. The next major support is near the $1.000 level.
Technical Indicators
4-hours MACD – The MACD for ADA/USD is slowly losing momentum in the bullish zone.
4-hours RSI (Relative Strength Index) – The RSI for ADA/USD is now approaching the 50 level.
Major Support Levels – $1.165, $1.150 and $1.050.
Major Resistance Levels – $1.200, $1.220 and $1.280.
Source: Read Full Article


