
Ethereum Bulls Take Breather, This Scenario Could Trigger A Correction
Ethereum price extended its increase above the $2,000 resistance against the US Dollar. ETH is slowly moving lower and might decline if it breaks the $2,075 support.
- Ethereum started a strong increase above the $2,000 and $2,050 resistance levels.
- The price is trading above $2,000 and the 100-hourly Simple Moving Average.
- There is a major bullish trend line forming with support near $2,090 on the hourly chart of ETH/USD (data feed via Kraken).
- The pair could start a downside correction below the $2,075 support zone.
Ethereum Price Faces Resistance
Ethereum’s price gained pace after there was a clear move above the $2,000 resistance zone. ETH even climbed above the $2,080 resistance zone before the bears appeared near the $2,120 zone.

A high was formed near the $2,141 level before the price started a downside correction, similar to Bitcoin. There was a move below the $2,100 level but the downsides were limited. A low is formed near $2,075 and the price is now consolidating gains.
Ether price trading above $2,000 and the 100-hourly Simple Moving Average. There is also a major bullish trend line forming with support near $2,090 on the hourly chart of ETH/USD. Immediate resistance is near the $2,110 zone. It is near the 50% Fib retracement level of the downward move from the $2,141 swing high to the $2,075 low.
The next major resistance is near the $2,125 zone or the 76.4% Fib retracement level of the downward move from the $2,141 swing high to the $2,075 low.
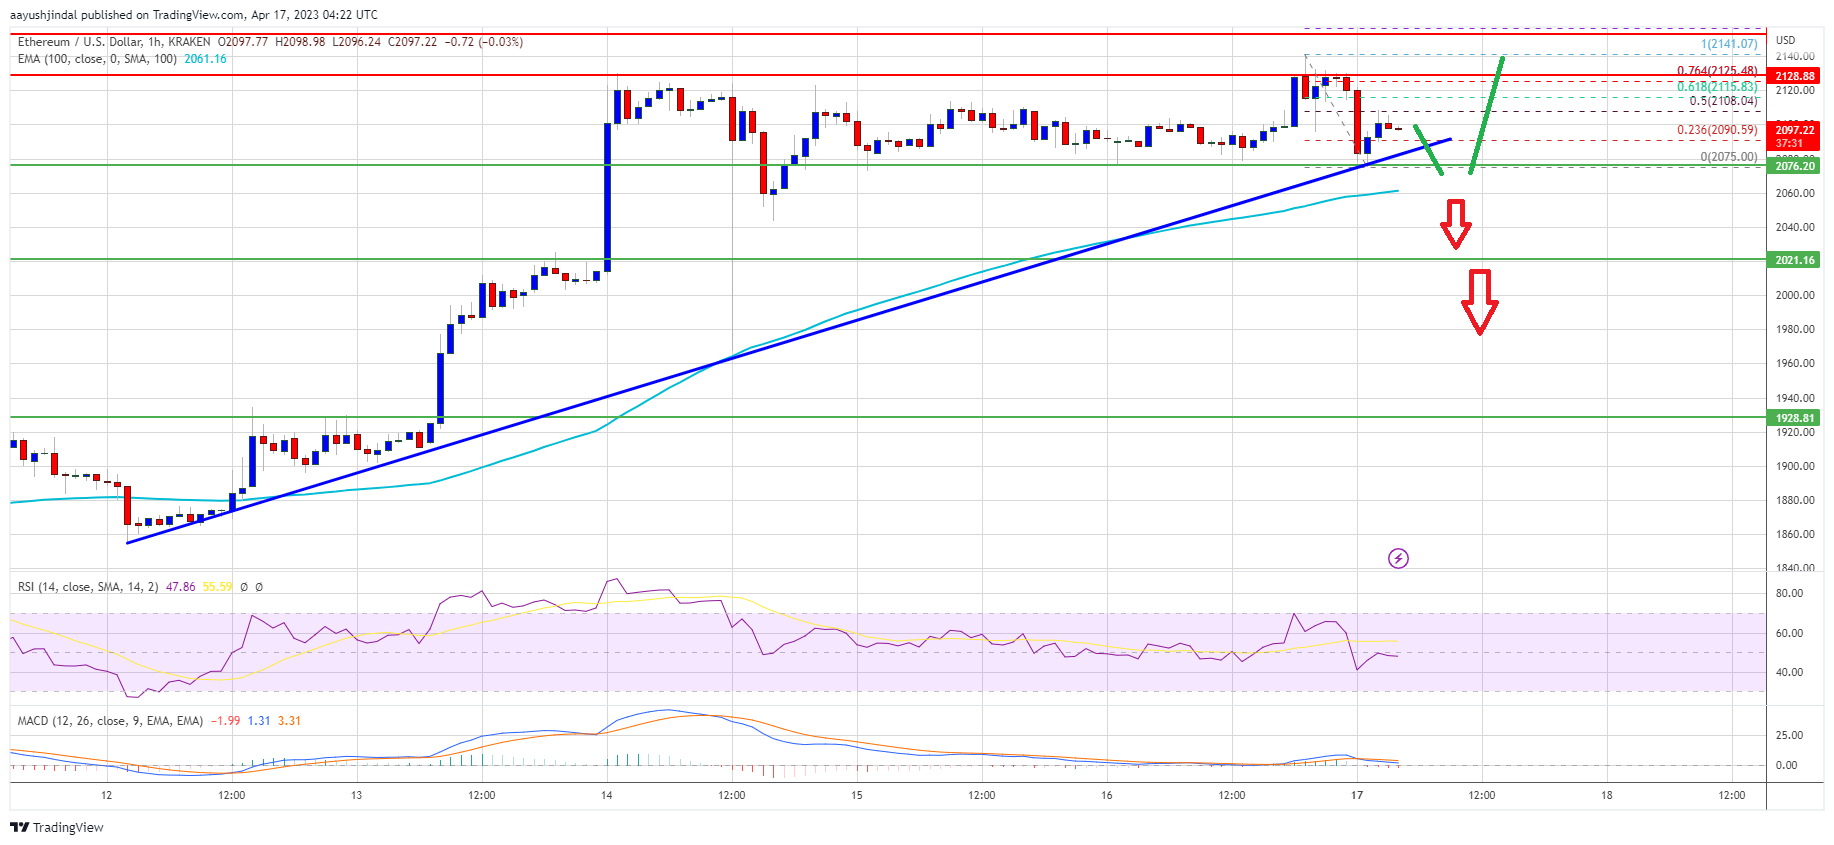
Source: ETHUSD on TradingView.com
A close above the $2,125 resistance zone could start another strong increase. In the stated case, the bulls might aim for a move toward the $2,200 resistance. Any more gains could set the pace for a test of the $2,320 resistance.
Downside Break in ETH?
If Ethereum fails to clear the $2,125 resistance, it could start a downside correction. Initial support on the downside is near the $2,090 level and trend line.
The next major support is near the $2,075 zone, below which ether price might decline toward the $2,020 level. The main support is now forming near the $1,925 and $1,920 levels.
Technical Indicators
Hourly MACD – The MACD for ETH/USD is now losing momentum in the bullish zone.
Hourly RSI – The RSI for ETH/USD is just below the 50 level.
Major Support Level – $2,075
Major Resistance Level – $2,125
Source: Read Full Article