
Is Bitcoin Truly Done With Cycle Lows? Here's What This Metric Says
Is Bitcoin truly done with the bear market bottom or is there more to come still? Here’s what the “RHODL ratio” has to say about it.
Bitcoin RHODL Ratio Has Been Declining In Recent Days
As pointed out by an analyst on Twitter, the leg for the next bull run could be here according to the RHODL ratio. The “Realized HODL” (RHODL) ratio is an indicator that measures the ratio between two RHODL waves. The RHODL wave bands are groups of the Bitcoin supply divided based on the age of the coins. For example, the 1-2 years wave band includes all coins that are between one and two years old.

Usually, the RHODL ratio is taken between segments of the “long-term holder” (LTH) and “short-term holder” (STH) groups. The LTHs include all investors that have been holding their coins since at least six months ago, while the STHs have been holding them since less than this threshold amount.
In the context of the current discussion, the wavebands of interest are the 6 months to 2 years (meaning that the LTHs who bought within a cycle) and 1 day to 3 months (the youngest of the STHs).
The analyst here has taken the RHODL ratio between these two bands, meaning that its trend can provide hints about how the capital is rotating between the STHs and LTHs.
Now, here is a chart that shows how the Bitcoin RHODL ratio for these two groups has changed over the entire history of the cryptocurrency:
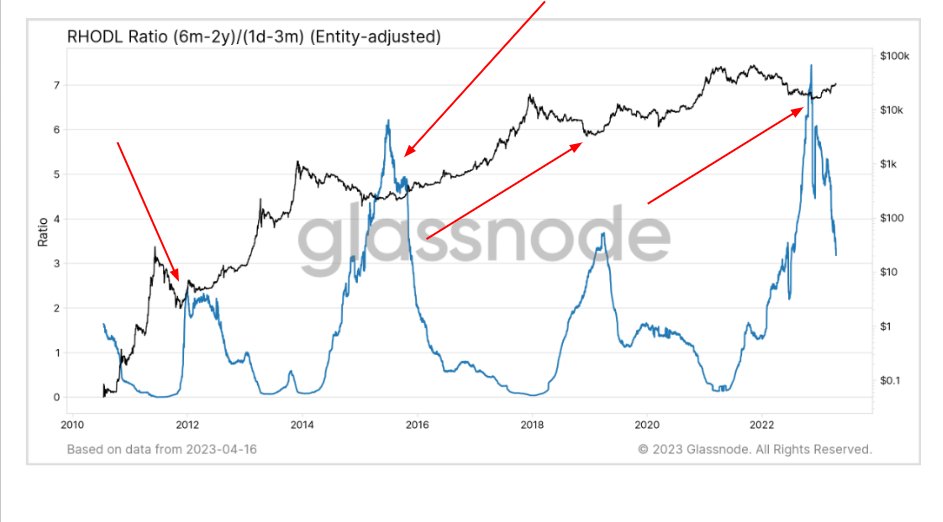
The value of the metric seems to have sharply declined in the last few months | Source: James V. Straten on Twitter
As shown in the above graph, the Bitcoin RHODL ratio for the 6 months to 2 years and 1 day to 3 months wave bands had hit some pretty high values back when the crash due to the collapse of the cryptocurrency exchange FTX took place.
So far, the lows that were observed after this crash have been the lowest the cryptocurrency has gone during the current cycle. In the chart, the analyst has also highlighted the trend that the indicator showed during the bear market bottoms of the past cycles.
It looks like the RHODL ratio for these cohorts has always hit relatively high values during the major bottoms in the asset’s price. If this historical trend is anything to go by, the fact that the lows after the FTX crash displayed a similar pattern may suggest that those prices were indeed cyclical lows.
There is always the chance, though, that the indicator could reverse its trend and rise to even higher highs, which would then coincide with the true cyclical lows for the asset. However, considering that the metric has been going down pretty sharply in the past few months, it would be quite unprecedented if the trend reverses now.
BTC Price
At the time of writing, Bitcoin is trading around $29,500, up 4% in the last week.

Source: Read Full Article