Litecoin (LTC) Price Analysis: Risk of More Losses Below $70
Earn Your First Bitcoin Sign up and get $12 Bonus Referral bonus up to $3,000
- Litecoin is showing bearish signs and trading below $80 against the US Dollar.
- LTC price is now trading below $78 and the 55 simple moving average (4 hours).
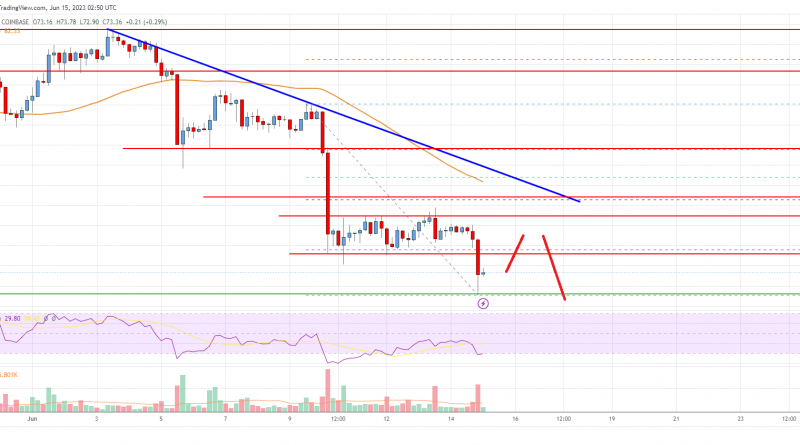
- There is a key bearish trend line forming with resistance near $80.60 on the 4-hour chart of the LTC/USD pair (data feed from Coinbase).
- The pair could start a decent increase if it clears the $82 resistance zone.
Litecoin price is struggling below $80 against the US Dollar, similar to Bitcoin. LTC price could continue to decline if it stays below the $82 resistance zone.
Litecoin Price Analysis

In the past few days, there was a short-lived recovery in Bitcoin, Ethereum, Ripple, and Litecoin against the US Dollar. Earlier, LTC settled below the $90 resistance zone to move into a bearish zone.
The price broke the $82 support zone and started a fresh decline. It even traded below the $80 support. A low is formed near $71.09 and the price is now consolidating losses. It is now trading below $78 and the 55 simple moving average (4 hours).
There is also a key bearish trend line forming with resistance near $80.60 on the 4-hour chart of the LTC/USD pair. Immediate resistance is near the $75.60 level. It is close to the 23.6% Fib retracement level of the downward move from the $90.08 swing high to the $71.09 low.
The next major resistance is near the $80 level or the trend line. The trend line is close to the 50% Fib retracement level of the downward move from the $90.08 swing high to the $71.09 low.
A clear move above the $80 level could pump the price toward the $82 level or even $85. The next major resistance could be $90.
On the downside, immediate support is near the $72 level. The next key support is near the $70 level. If there is a downside break below the $70 support, the price could accelerate lower toward the $65 level in the near term.

Litecoin (LTC) Price
Looking at the chart, Litecoin price is clearly trading below $80 and the 55 simple moving average (4 hours). Overall, the price could continue to move down if it stays below the $82 resistance zone.
Technical indicators
4 hours MACD – The MACD for LTC/USD is now gaining pace in the bearish zone.
4 hours RSI (Relative Strength Index) – The RSI for LTC/USD is now below the 50 level.
Key Support Levels – $72.00 and $70.00.
Key Resistance Levels – $75.60 and $80.00.
Source: Read Full Article