Litecoin Makes a Sharp Fall Above the $220 Support
Litecoin (LTC) is in a downtrend. Since November 10, the cryptocurrency has reached an overbought region of the market.
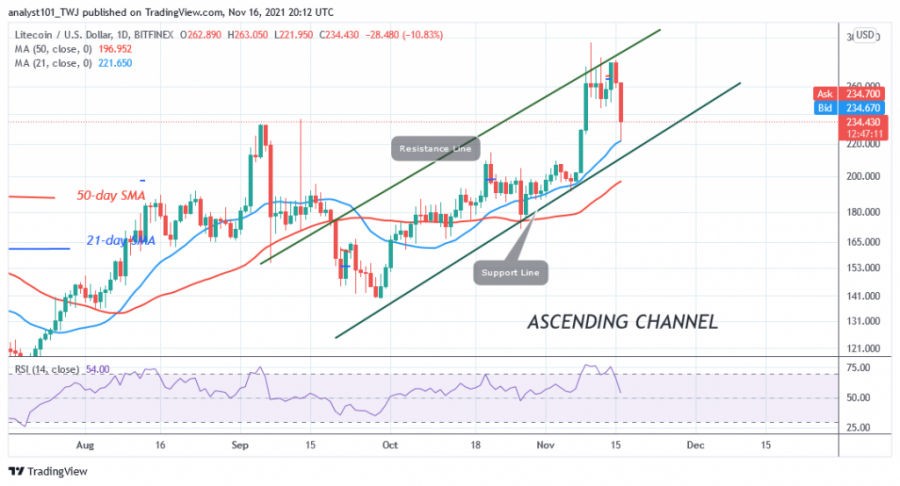
The altcoin rallied to a high of $295 and then retreated above the $260 support. Litecoin fell sharply to a low of $221 as the bulls encountered rejection at the high of $280. The cryptocurrency asset is now trading above the 21-day moving average line. In addition, LTC/USD is trading above support at $236, the historical price level from September 5. The cryptocurrency will continue its upward movement if the current support holds. Moreover, the altcoin is trading above the moving averages, which will continue to drive the upward price movement.
Litecoin indicator analysis

Litecoin has fallen from 75 to 54 in the Relative Strength Index for the 14 period. The market will resume its upward movement as it is in the bullish trend zone. Likewise, it is above the 25% range of the daily stochastic. The cryptocurrency has resumed its bullish momentum. There is a possibility of a price move to the upside if buyers get back above the $220 support.
Technical Indicators:
Resistance Levels: $240, $280, $320
Support Levels: $200, $160, $120
What is the next move for Litecoin?
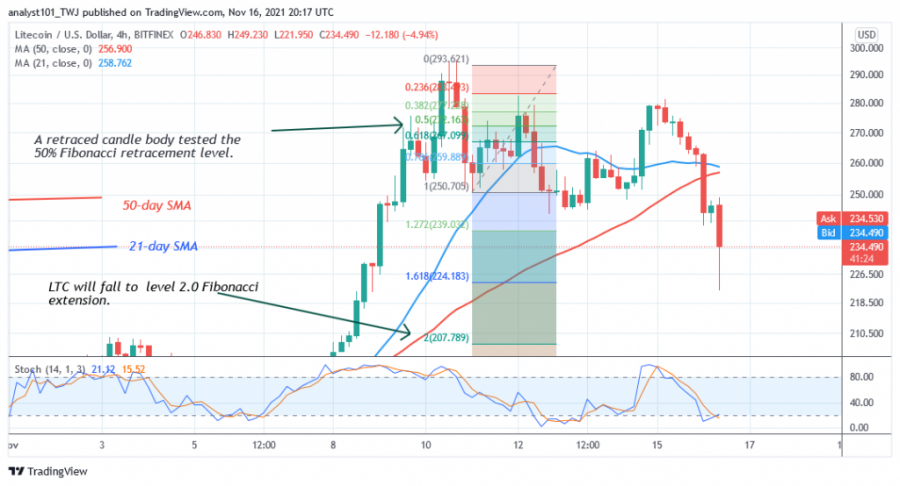
On the 4-hour chart, Litecoin is in a downtrend. The LTC price has fallen below the moving averages. It has also hit the low of $221 and retreated. Meanwhile, on November 11, the downtrend tested the 50% Fibonacci retracement level. The retracement suggests that LTC will fall to the 2.0 Fibonacci extension level or $207.78.
Disclaimer. This analysis and forecast are the personal opinions of the author and are not a recommendation to buy or sell cryptocurrency and should not be viewed as an endorsement by CoinIdol. Readers should do their own research before investing funds.
Source: Read Full Article