Litecoin Makes Lower Highs and Lower Lows as Bears Threaten to Short
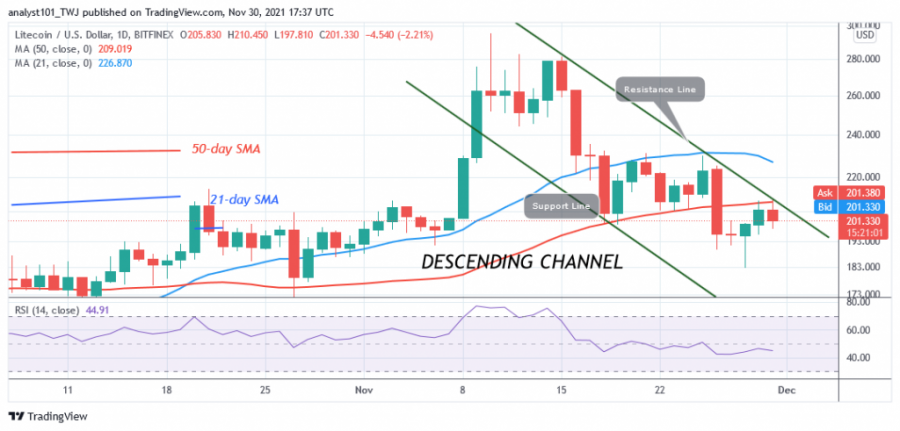
On November 28, Litecoin (LTC) fell to a low of $182 as the bulls bought the dips. Today, the upside correction threatens to fail at $210 resistance or the 50-day moving average line.
There is a likelihood of further downside. After the downward impulse on November 18, the LTC price posted a series of lower highs and lower lows. Today, Litecoin faces rejection at a lower high of $210. The market is likely to fall to a lower low. On the downside, the altcoin will fall to either $171 or $166 on a break below $188 support. On the other hand, if the altcoin recovers above the $188 support, the cryptocurrency will resume its uptrend.
Litecoin indicator analysis
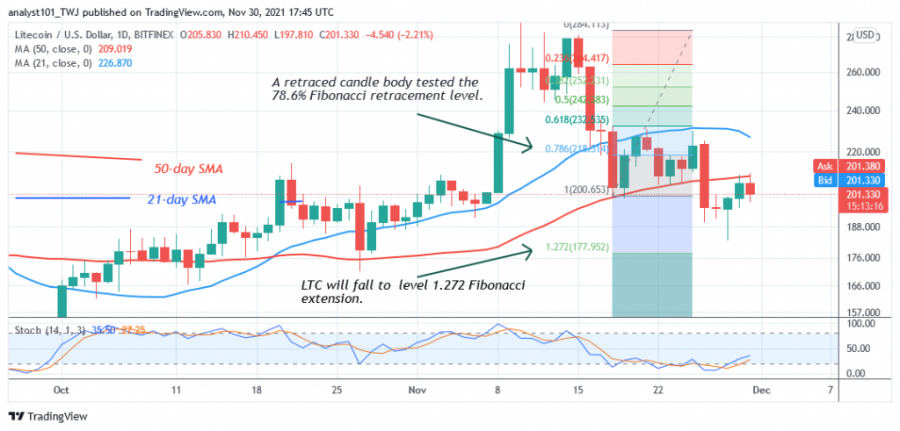
Litecoin’s price bars are below the 21-day line and the 50-day moving average line, indicating further downward price movement. Similarly, LTC price is at level 45 of the Relative Strength Index for period 14. The altcoin is still in the downtrend zone. Litecoin is above the 25% range of the daily stochastic. The bullish momentum is weakening.
Technical Indicators
Resistance Levels: $240, $280, $320
Support Levels: $200, $160, $120
What is the next move for Litecoin?
On the daily chart, Litecoin is still in the downtrend zone. The LTC price is falling to a high of $210. Meanwhile, the downtrend from November 18 has a candle body testing the 78.6% Fibonacci retracement level. The retracement suggests that LTC price will fall to the 1.272 Fibonacci extension level or $177.95.
Disclaimer. This analysis and forecast are the personal opinions of the author and are not a recommendation to buy or sell cryptocurrency and should not be viewed as an endorsement by CoinIdol. Readers should do their own research before investing funds.
Source: Read Full Article


