Litecoin Makes Upward Correction, Can Bulls Sustain the Upturn?
Litecoin (LTC) is correcting upward after revisiting the previous low above $118.50. Buyers have pushed the altcoin to the high of $143.
However, if the altcoin is repelled from the recent high, the bears will attempt to break the $118 support level. LTC /USD will decline to $96 or $70 if the bears break the current support.

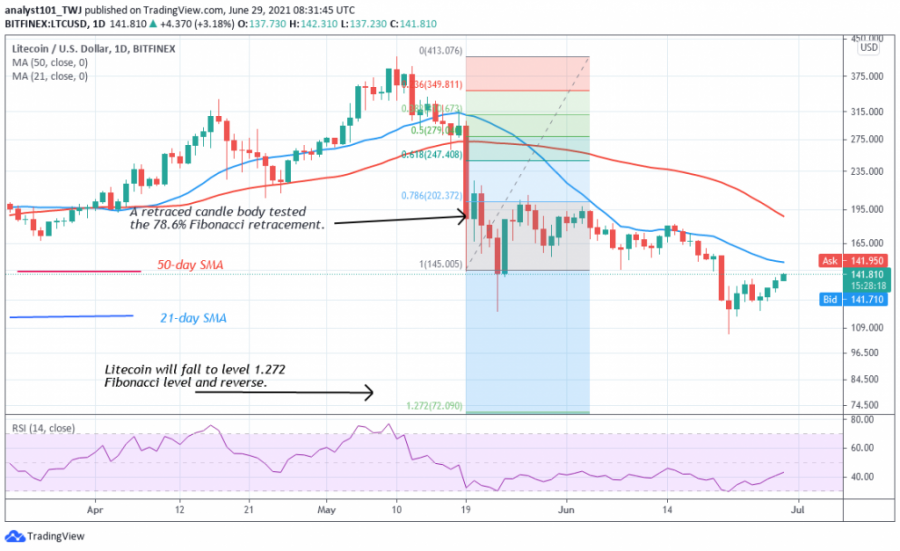
Nevertheless, the crypto can come out of a downward correction if the bullish move is sustained above the $ 230 price level. Meanwhile, on May 19 downtrend; a retraced candle body tested the 78.6% Fibonacci retracement level. This retracement indicates that the market will fall to level 1.272 Fibonacci extensions or level $72.09. The price indicator has indicated a possible reversal at $72.09 low.
Litecoin indicator analysis
LTC price has risen to level 43 of the Relative Strength Index period 14. This implies that the market is in the downtrend zone and below the centerline 50. Litecoin is above the 80% range of the daily stochastic. It indicates that the altcoin has reached the overbought region of the market. Litecoin may fall because sellers are likely to emerge.
Technical indicators:
Major Resistance Levels – $500 and $540
Major Support Levels – $160 and $120
What is the next move for Litecoin?
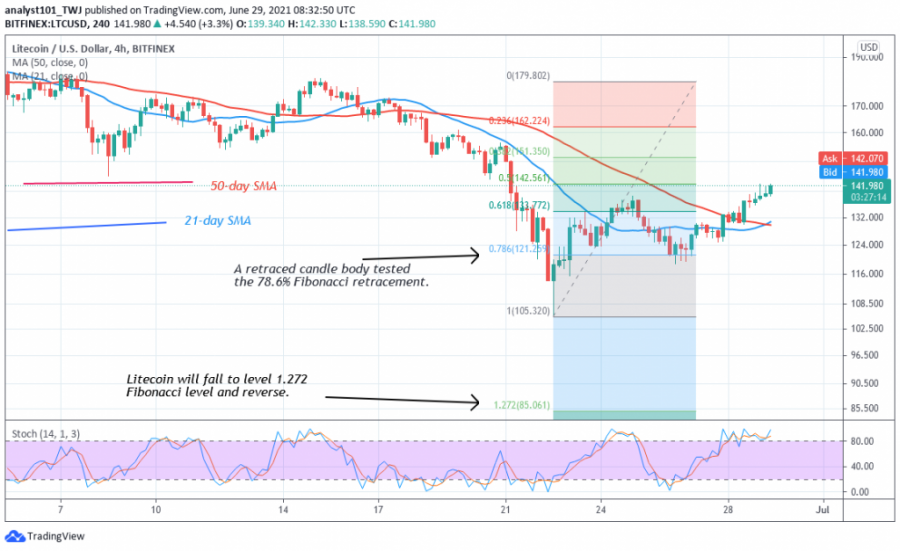
On the 4 –hour chart, the LTC price is correcting upward. At the same time, the market has reached the overbought region. Therefore, the current uptrend may be short-lived. On June 22 downtrend; a retraced candle body tested the 78.6% Fibonacci retracement level. This retracement indicates that the market will fall to level 1.272 Fibonacci extensions or level $85.06.
Disclaimer. This analysis and forecast are the personal opinions of the author are not a recommendation to buy or sell cryptocurrency and should not be viewed as an endorsement by CoinIdol. Readers should do their own research before investing funds.
Source: Read Full Article