Polkadot Attempts to Breach $40 Resistance, Lacks Buyers at Higher Price Levels
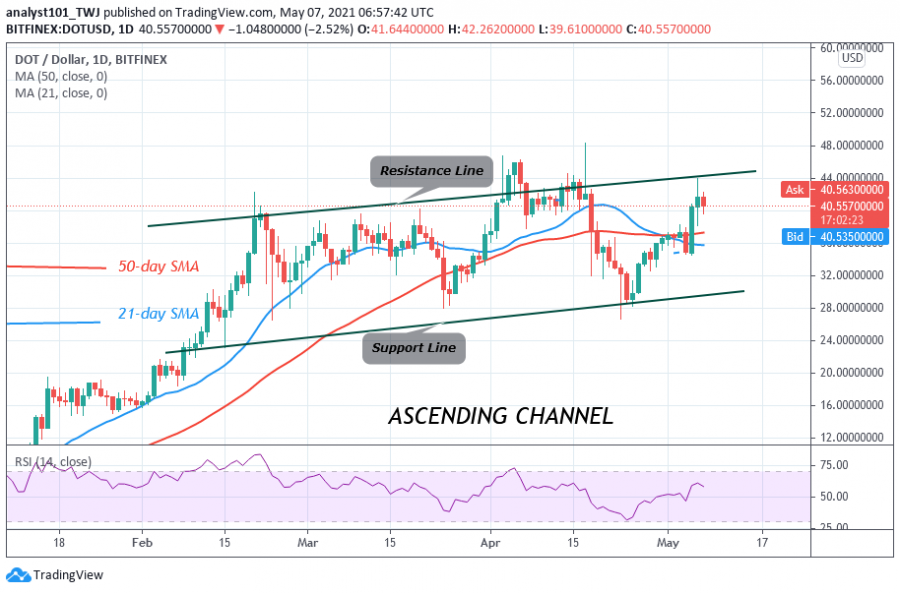
DOT/USD is making an upward move as it retests the $40 overhead resistance. Each time buyers push the altcoin above the overhead resistance, the altcoin will fall into the range-bound zone.
The bulls have not been able to sustain the bullish momentum above the overhead resistance since February 20. Buyers fail to sustain the bullish momentum because of the presence of sellers.

Polkadot will resume an uptrend if the overhead resistance is breached and the bullish momentum is sustained. The market will rise and reach a new high of $60 if the bullish momentum is sustained above the resistance. However, the market will continue its range bound move if the resistance remains unbroken.
Polkadot indicator analysis
DOT price has risen to level 60 of the Relative Strength Index period 14. It indicates that the market has reached the bullish trend zone and above the centerline 50. The 21-day SMA and the 50-day SMA are sloping horizontally.
Technical indicators:
Major Resistance Levels – $48 and $52
Major Support Levels – $32 and $28
What is the next direction for Polkadot?
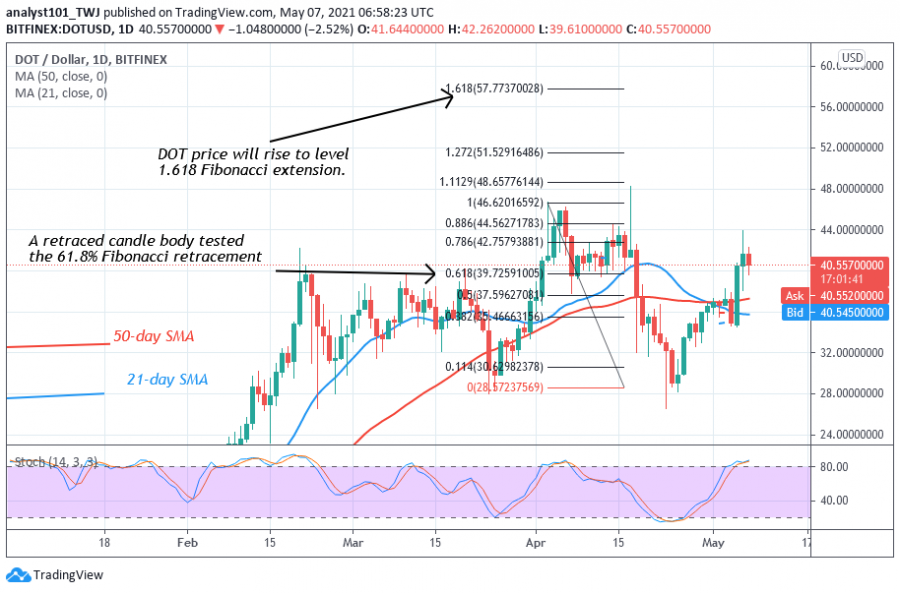
Polkadot has continued its sideways move below the resistance. The Fibonacci tool has indicated an upward movement of the coin. Meanwhile, on April 3 uptrend; a retraced candle body tested the 61.8 % Fibonacci retracement. This retracement indicates that DOT will rise to level 1.618 Fibonacci extension or a high of $57.77. The Fibonacci tool will hold if the altcoin resumes an upward move.
Disclaimer. This analysis and forecast are the personal opinions of the author that are not a recommendation to buy or sell cryptocurrency and should not be viewed as an endorsement by CoinIdol. Readers should do their research before investing funds.
Source: Read Full Article