Polkadot Makes Series of Higher Highs and Higher Lows, Faces Rejection at $30
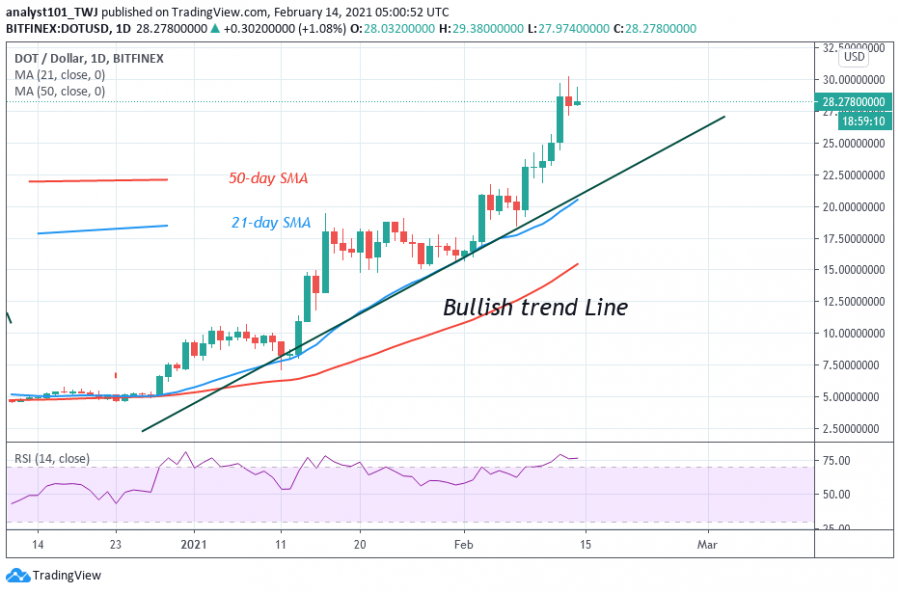
Polkadot (DOT) price has been making a series of higher highs and higher lows since December 2020. Yesterday, the price made a higher high of $30 but the price was resisted.
Today, DOT is consolidating below the $30 resistance level for a possible upward move. It is believed that when price consolidates below a resistance level, the chances of a possible breakout are very high. On the upside, if price breaks at the $30 resistance, the market will reach a high of $40. However, in the meantime, a breakout is not likely as the RSI has indicated that the cryptocurrency has reached the overbought region. In the meantime, sellers may emerge to push prices down. Possibly, the uptrend will resume if the price retraces and finds support either at $28 or $24 low.
Polkadot indicator analysis

DOT is above level 75 of the Relative Strength Index period 14. It indicates that the upward move is doubtful as price reaches the overbought region. The cryptocurrency is below the 40% range of the daily stochastic. This indicates that the market has bearish momentum.
Technical indicators:
Major Resistance Levels – $30 and $32.50
Major Support Levels – $20 and $17.50
What is the next direction for Polkadot?
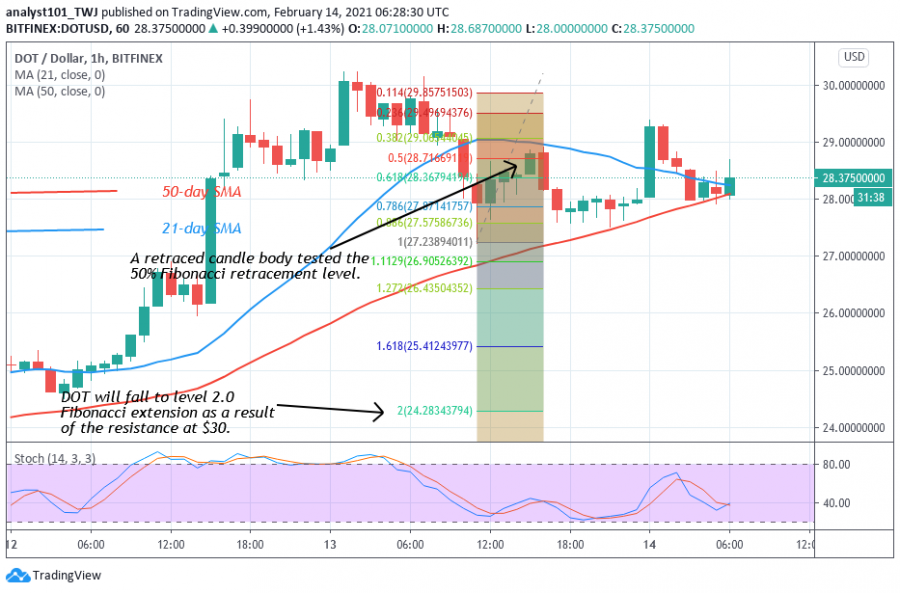
Polkadot is facing rejection at the $30 high. There is a possibility of a further downward move of DOT. On February 13 Downtrend; a retraced candle body tested the 50 % Fibonacci retracement level. This retracement indicates that DOT will fall to level 2.0 Fibonacci extensions or a low of $24.28.
Disclaimer. This analysis and forecast are the personal opinions of the author that are not a recommendation to buy or sell cryptocurrency and should not be viewed as an endorsement by CoinIdol. Readers should do their research before investing funds.
Source: Read Full Article