Polkadot May Resume Uptrend If The Altcoin Jumps The Hurdles At $44 And $46 Price Levels
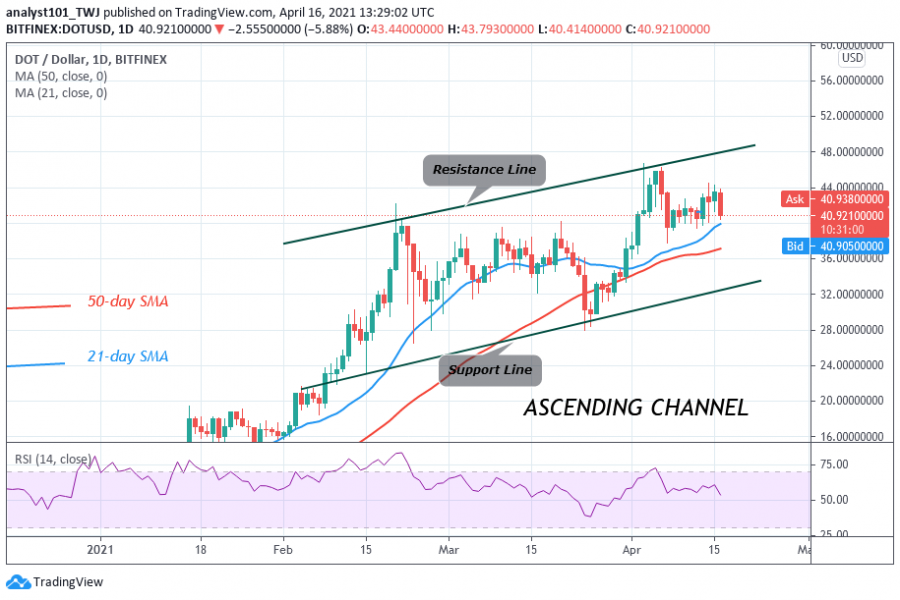
Polkadot's (DOT) price is falling after buyers retested the high of $44 twice on April 14 and 15. Incidentally, this is another bearish double top pattern in April. This pattern formation indicates that Polkadot will resume another downward move. Presently, DOT price is fluctuating in a tight range between levels $40 and $44.
On the upside, if buyers break the minor resistance at $44, a retest at the $46 overhead resistance is possible. The market will rise to $58 high if buyers are successful above the overhead resistance. Conversely, if sellers break below the $40 support, the market will decline to either $32 or $28 low. In the meantime, the DOT/USD is trading at $42.12 at the time of writing.
Polkadot indicator analysis

The altcoin is at level 56 of the Relative Strength Index period 14. It indicates that price is in the bullish trend zone. There is a tendency of price rise on the upside. The stochastic bands are sloping horizontally below the 60% range of the daily stochastic. It indicates that the altcoin is in a sideways move.
Technical indicators:
Major Resistance Levels – $44 and $48
Major Support Levels – $24 and $20
What is the next direction for Polkadot?
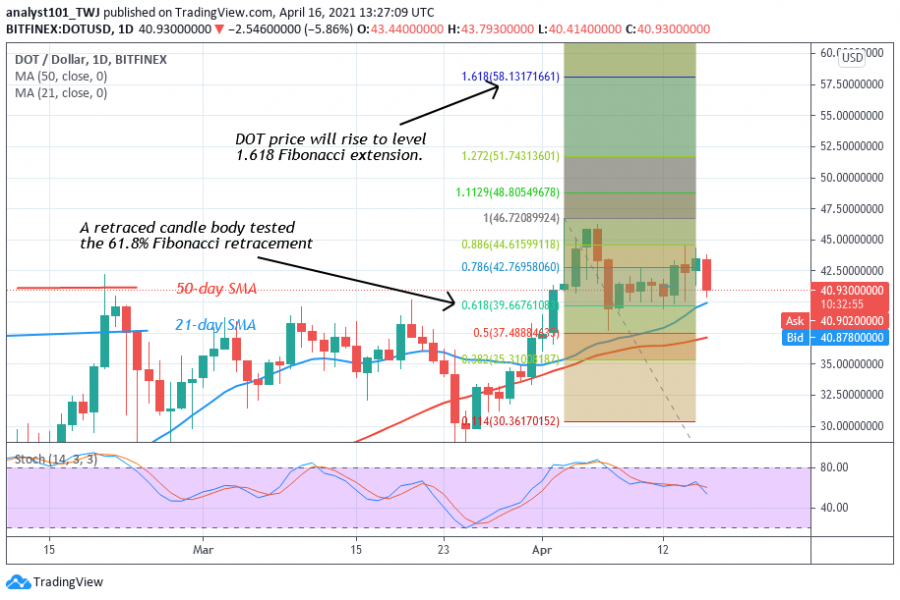
Polkadot is still in a range-bound move below the overhead resistance. The uptrend will resume if price breaks the $44 and $46 resistance levels. On April 16 uptrend; a retraced candle body tested the 61.8 % Fibonacci retracement. This retracement indicates that DOT will rise to level 1.618 Fibonacci extension or a high of $58.13.
Disclaimer. This analysis and forecast are the personal opinions of the author that are not a recommendation to buy or sell cryptocurrency and should not be viewed as an endorsement by CoinIdol. Readers should do their research before investing funds.
Source: Read Full Article