
Polkadot Trades Marginally Above The $5.00 Support
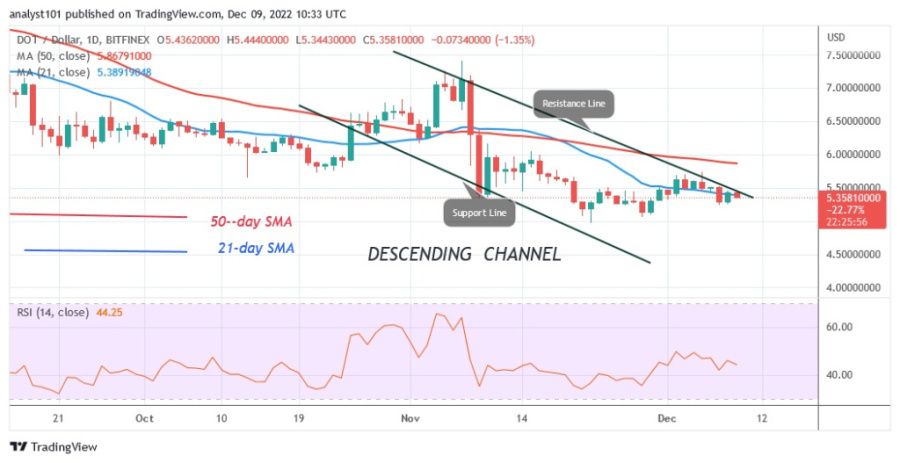
The price of Polkadot (DOT) is falling as it has broken below the 21-day line SMA. The rejection of the high at $5.70 led to the current decline.
Polkadot price long-term analysis: bearish
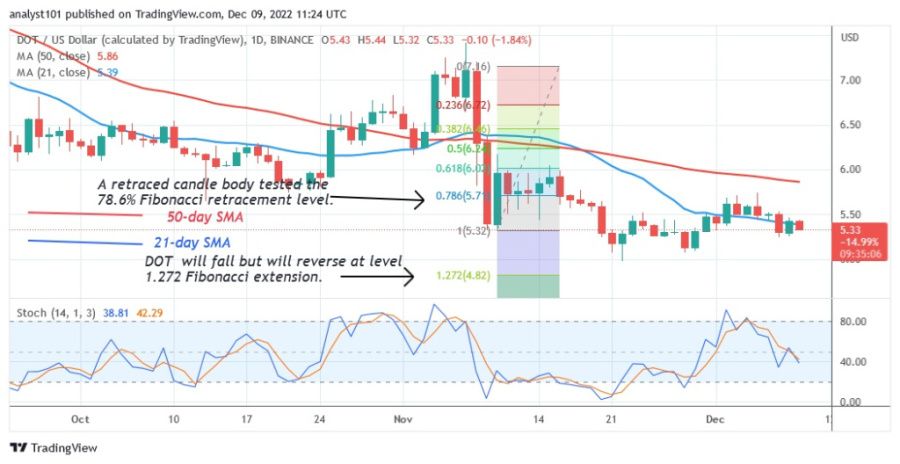
The previous range bounded zone, between $5.34 and $6.17, will be reached when the DOT price falls. The cryptocurrency value has been moving within the current price range since November 10. On the downside, DOT price will retest the $5.34 support level if the negative momentum below the 21-day SMA line is maintained. At the time of writing, Polkadot is currently trading at $5.35.
Polkadot indicator analysis

The price of DOT is at the 44 level of the Relative Strength Index for the 14 period, which means that the altcoin is in a bearish trend zone. The price bars of the cryptocurrency are below the moving average line, which indicates a decline. The 21-day line SMA is crossed and broken by the price.
Technical indicators
Key resistance levels – $10 and $12
Important support levels – $6 and $4
What is the next direction for Polkadot?
Polkadot is currently trading slightly below the 21-day line SMA. If the price falls below the 21-day moving average line, the altcoin will lose value. If the price stays above the 21-day line SMA, the sideways movement can continue.
Disclaimer. This analysis and forecast are the personal opinions of the author and are not a recommendation to buy or sell cryptocurrency and should not be viewed as an endorsement by CoinIdol. Readers should do their research before investing in funds.
Source: Read Full Article