Stellar Lumen (XLM) Price Faces Uphill Task Near $0.086
Earn Your First Bitcoin Sign up and get $12 Bonus Referral bonus up to $3,000
- Stellar lumen price is struggling below the $0.0880 resistance zone against the US Dollar.
- XLM price is now trading below $0.0880 and the 55 simple moving average (4 hours).
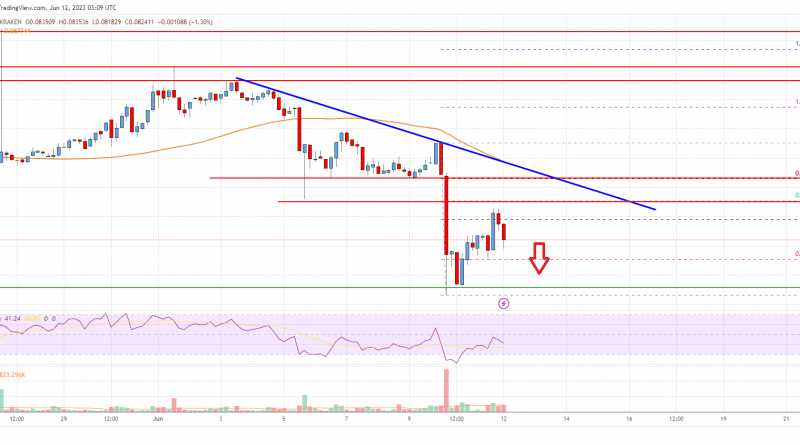
- There is a major bearish trend line forming with resistance near $0.0855 on the 4-hour chart (data feed via Kraken).
- The pair could start a recovery wave if it clears the $0.0855 resistance.
Stellar lumen price is trading below $0.0880 against the US Dollar, similar to Bitcoin. XLM price could extend losses if it trades below the $0.0800 support.
Stellar Lumen Price Analysis (XLM to USD)

After a sharp decline below $0.085, Stellar Lumen price struggled to gain bullish momentum against the US Dollar. The XLM/USD pair traded below the $0.0820 level to move further into a bearish zone.
A low was formed near $0.0786 before the price started an upside correction. There was a move above the $0.0800 and $0.0810 levels. The price climbed above the 23.6% Fib retracement level of the recent decline from the $0.0890 swing high to the $0.0786 low.
The price is now facing resistance near the $0.0838 level. It is close to the 50% Fib retracement level of the recent decline from the $0.0890 swing high to the $0.0786 low.
There is also a major bearish trend line forming with resistance near $0.0855 on the 4-hour chart. XLM is now trading below $0.0850 and the 55 simple moving average (4 hours). Initial support on the downside is near the $0.0810 level. The next major support is near the $0.0800 zone.
Any more losses could lead the price toward the $0.0785 level in the near term, below which the price might even retest $0.07650. On the upside, the price is facing resistance near the $0.0855 level and the trend line.
A clear upside break above the $0.0855 zone might send the price toward $0.0880. Any more gains could lead the price toward the $0.0900 level or even $0.0920.

Stellar Lumen (XLM) Price
The chart indicates that XLM price is now trading below $0.0880 and the 55 simple moving average (4 hours). Overall, the price could start a recovery wave if it clears the $0.0855 resistance.
Technical Indicators
4 hours MACD – The MACD for XLM/USD is gaining momentum in the bearish zone.
4 hours RSI – The RSI for XLM/USD is now below the 50 level.
Key Support Levels – $0.0810 and $0.080.
Key Resistance Levels – $0.0838, $0.0850, and $0.0855.
Source: Read Full Article