Stocks to Watch This Week – Expedia Group, Inc
Is Expedia Inc (NASDAQ: EXPE) Trending Bullish?
Expedia (NASDAQ: EXPE) opened 2021 at $130.96. The stock has appreciated markedly since then, with bullish performance expectations across the short, medium, and long-term. For reasons that will be listed below, Expedia is one of the stocks to watch this week.
The stock is regarded as overvalued by analysts, given its high price, negative earnings per share (-15.49), and lackluster 1-year target estimate price of $122.34. The spot price of Expedia is $144.17 [Friday, 15 January 2021]. Yet, the trend lines – evident from left to right in the chart above – are rising sharply.

EXPE has hit and missed on earnings expectations over the past 1 year. In Q4 2019, it exceeded consensus EPS, only to miss spectacularly in Q1 2020, and again in Q2 2020. By Q3 2020, Expedia posted an earnings beat.
This mercurial behavior can be attributed to geopolitical events which constrained the travel and tourism industry in particular, in 2020. For 2021, Q1 and Q2 will likely be hampered by the ongoing pandemic.
As widespread vaccinations take root around the world, travel and tourism will invariably start expanding and Expedia in particular will begin posting stronger returns.
Presently, the short-term outlook for Expedia stock is bullish (2 weeks – 6 weeks). Extrapolating further out is more challenging, but analysts are optimistic that Expedia will maintain a bullish performance 9 months + into the future.
It is worth pointing out that related stocks such as RCL, WYNN, TRIP, and BKNG have all posted solid gains heading into the second week of January. This is in line with general expectations of US bourses overall.
With the Biden presidency expected to inject a stimulus in the region of $2 trillion into the economy, much of that funding will go towards propping up various industries until they can stand on their own feet again.
Markets are reacting positively to the end of the Trump presidency, and the beginning of the Biden presidency.
Technical Indicators for Evaluating EXPE Stock
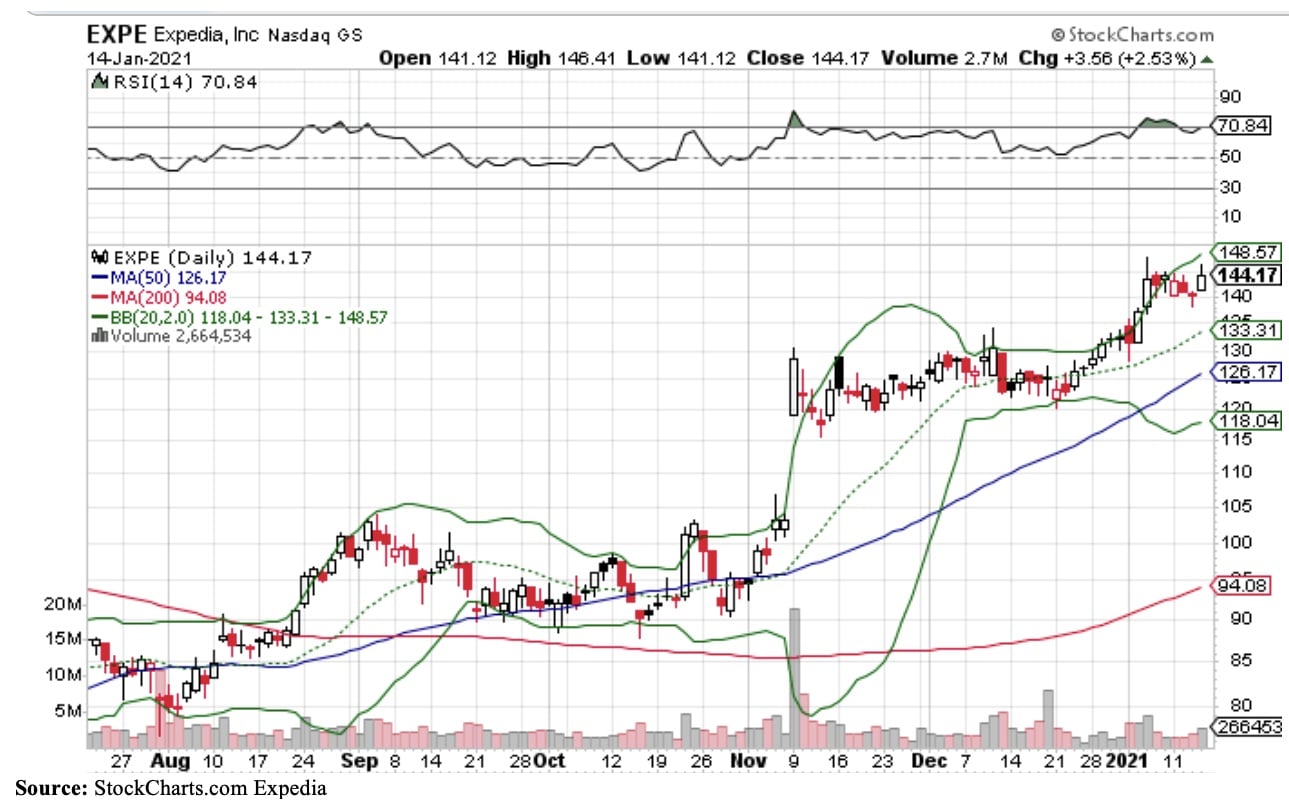
From a technical perspective, we can derive important information from the charts vis-a-vis Expedia stock. The 50-day moving average price is $126.17 (short-term moving average). The 200-day moving average price is $94.08 (long-term moving average).
Based on these numbers, and the spot price of $144.17, it is safe to say that the trajectory is strongly bullish. Note that Expedia traded under $100 per share through November 2020, and is now almost 50% up.
When it comes to indicators of potential future price movements, the Bollinger Bands are particularly useful.
In the case of Expedia [January 15, 2021], the lower Bollinger Band (20, 2,0) is 118.04, the median band is 133.31, and the upper band is 148.57. These figures provide an indication of what is likely to happen if the spot price approaches these levels.
If the price of EXPE breaches the upper Bollinger Band, a price reversal is likely to ensue. This happened when Expedia was trading around $130. At that point, it reversed sharply towards the median Bollinger Band level.
Presently, Expedia’s chart reflects a slight stabilization of prices, although the gap between the spot price and the upper band is narrowing. As more price stability returns, the distance between the upper and lower BB tightens.
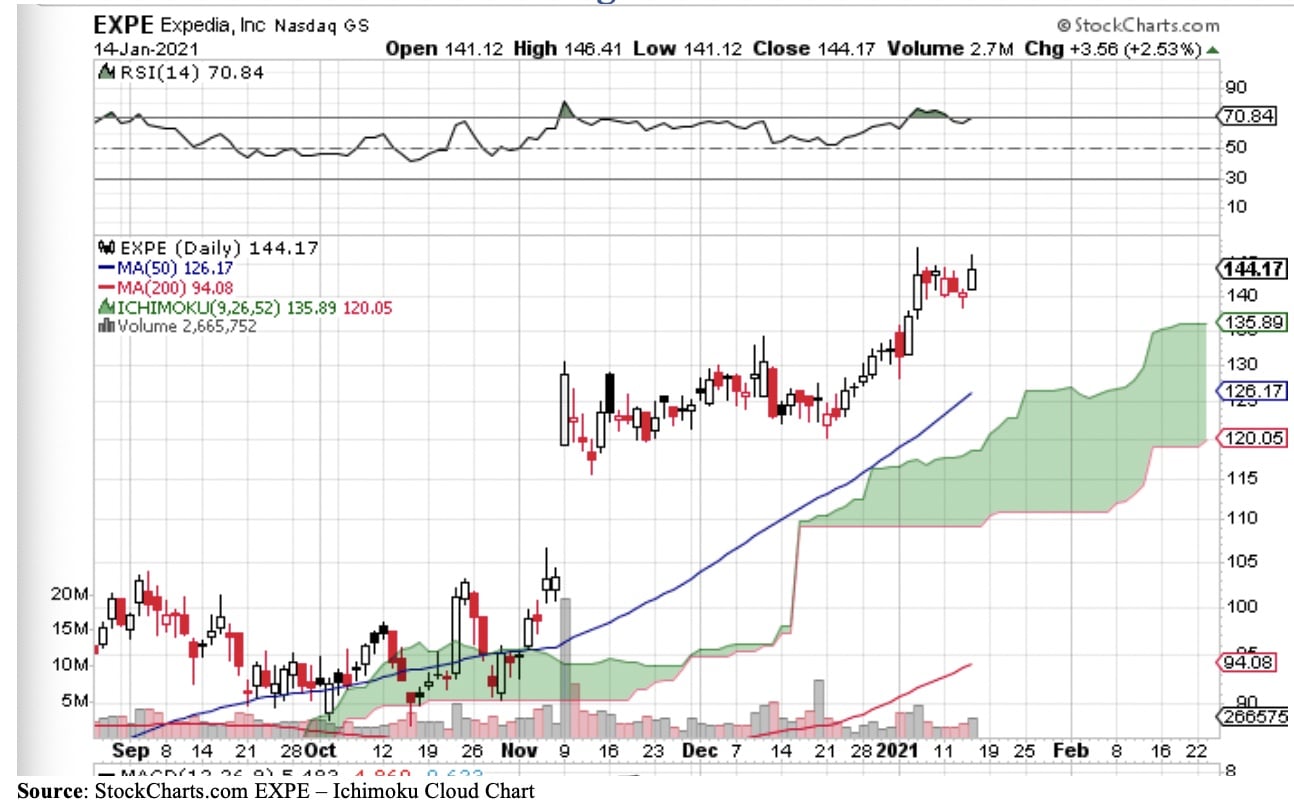
The Ichimoku Cloud and Expedia (NASDAQ: EXPE)
Other technical indicators such as the Ichimoku Cloud are powerful visual aids in determining where the momentum is with a stock’s price. As can be seen from the Expedia chart above, the Ichimoku Cloud is essentially a ‘one look equilibrium chart.’
The 5 lines in the Ichimoku Cloud include the Base Line, the Leading Span A, the Leading Span B, and the Lagging Span. When the price is above the green cloud, it reveals a bullish trend, as pictured above. This is a powerful indicator of projected prices.
*The aforementioned analysis was valid at the time of writing. Stock advice can be an accurate snapshot of stock performance; however, stocks are dynamic and prices can change at a moment’s notice. Traders and investors are strongly urged to conduct their own due diligence on individual stocks to assess their viability.
Source: Read Full Article