TA: Bitcoin Corrects 10%, Why BTC Could Extend Losses
Bitcoin price started a major downside correction and it traded below $55,000 against the US Dollar. BTC is showing a few bearish signs and it could extend losses towards $52,000.
- Bitcoin started a major decline and it broke the $58,000 and $55,000 support levels.
- The price is now trading well below $58,000 and the 100 hourly simple moving average.
- There was a break below a crucial bullish trend line with support near $58,100 on the hourly chart of the BTC/USD pair (data feed from Kraken).
- The pair is trading near $53,500 and it could correct higher in the short-term.
Bitcoin Price Declines Sharply
After a rejection above the $60,000 level, bitcoin started a major downside correction. BTC broke many important supports near $58,000 to move into a short term bearish zone.

There was also a break below a crucial bullish trend line with support near $58,100 on the hourly chart of the BTC/USD pair. The pair accelerated its decline below the $55,500 and $55,000 support levels. Finally, it tested the $53,000 support zone and formed a low at $53,174.


It is now trading well below $58,000 and the 100 hourly simple moving average. On the upside, an initial resistance is near the $54,950 level. It is close to the 23.6% Fib retracement level of the downward move from the $60,705 high to $53,174 low.
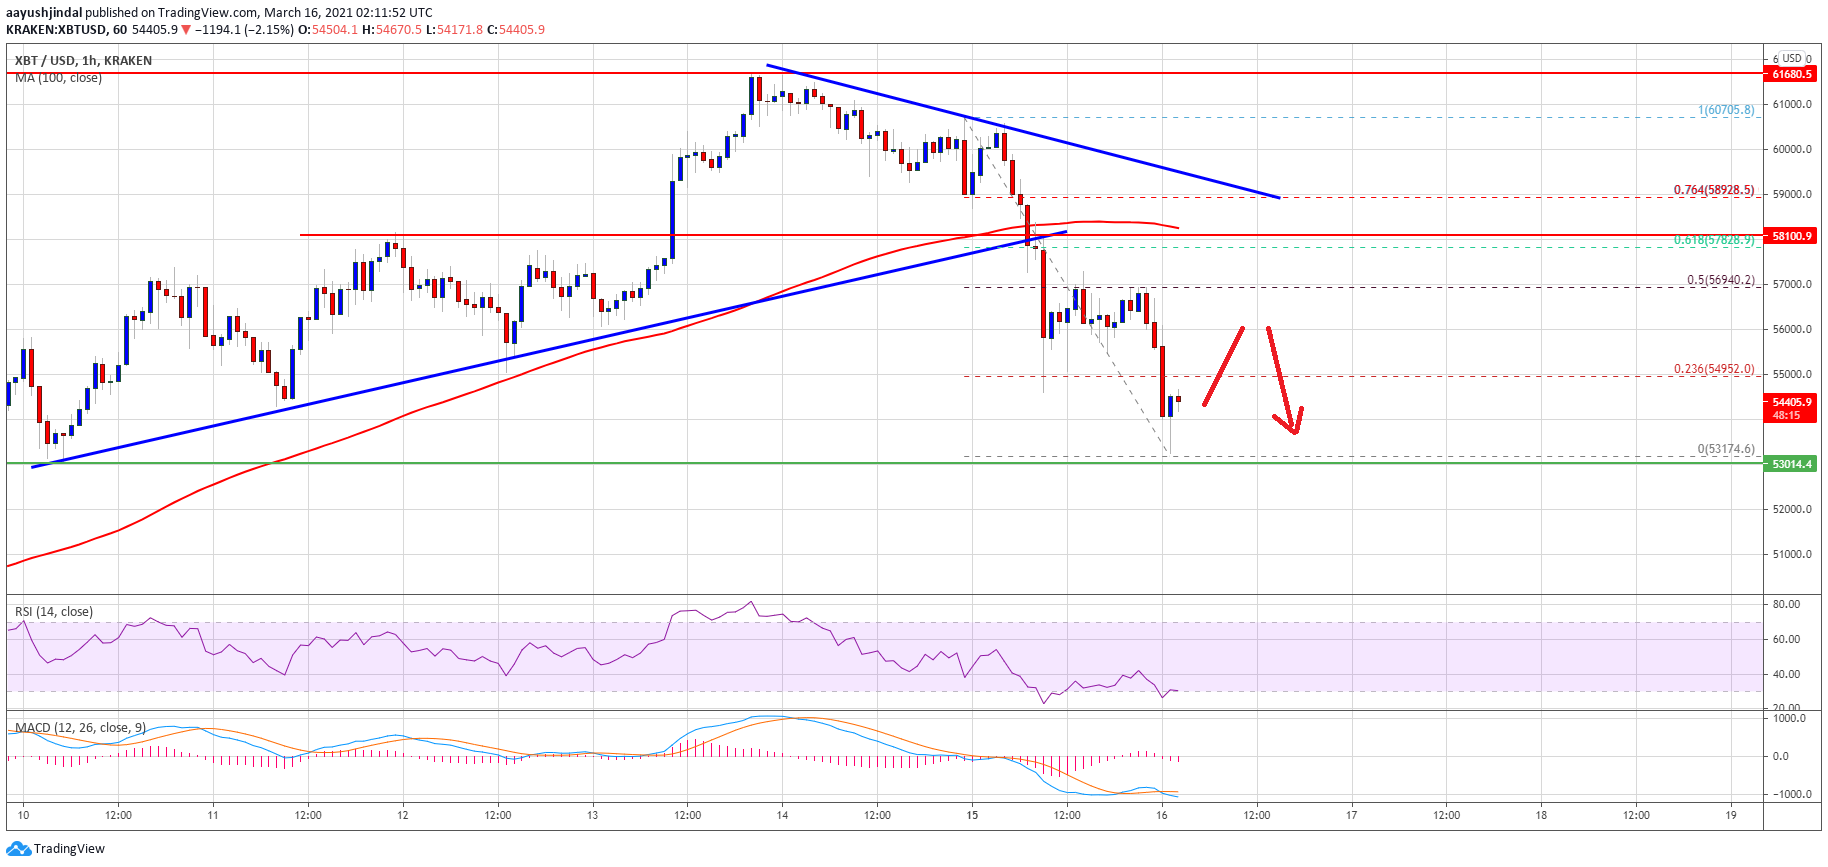
Source: BTCUSD on TradingView.com
The first major resistance is forming near the $57,000 level. The 50% Fib retracement level of the downward move from the $60,705 high to $53,174 low is also near $57,000. The main resistance is forming near the $58,000 level (the recent breakdown zone). A close above $58,000 is must to move back into a positive zone.
More Losses in BTC?
If bitcoin fails to correct higher above the $56,500 and $57,000 resistance levels, it could further correct lower. The first key support on the downside is near the $53,200 level.
The next key support is near the $52,000 level. If the bulls fail to protect the $52,000 support zone, the price could dive towards the $50,000 support level in the next few sessions.
Technical indicators:
Hourly MACD – The MACD is now gaining momentum in the bearish zone.
Hourly RSI (Relative Strength Index) – The RSI for BTC/USD is well below the 50 level.
Major Support Levels – $53,200, followed by $52,000.
Major Resistance Levels – $55,000, $57,000 and $58,000.
Source: Read Full Article