TA: Bitcoin Still Struggling Near $38K, Here’s Why 100 SMA Is The Key
Bitcoin price made another attempt to clear the $38,000 resistance against the US Dollar, but it failed. BTC is correcting lower, but it might find bids near the 100 hourly SMA.
- Bitcoin is still facing a strong resistance near the $38,000 zone.
- The price is currently trading well above $36,500 and the 100 hourly simple moving average.
- There is a connecting bullish trend line forming with support near $36,400 on the hourly chart of the BTC/USD pair (data feed from Kraken).
- The pair must stay above $36,000 and the 100 hourly SMA to remain in a positive zone.
Bitcoin Price Eyes Fresh Increase
Bitcoin started a decent increase above the $36,500 resistance zone. BTC even broke the $37,000 resistance level and settled well above the 100 hourly simple moving average.

The bulls made another important attempt to surpass the $38,000 barrier. However, they failed to gain strength and a new weekly high was formed near the $38,200 level. The price is now correcting lower and it is trading below the $37,800 level.


There was a break below the 23.6% Fib retracement level of the recent wave from the $35,928 swing low to $38,200 high. An immediate support on the downside is near the $37,000 level.
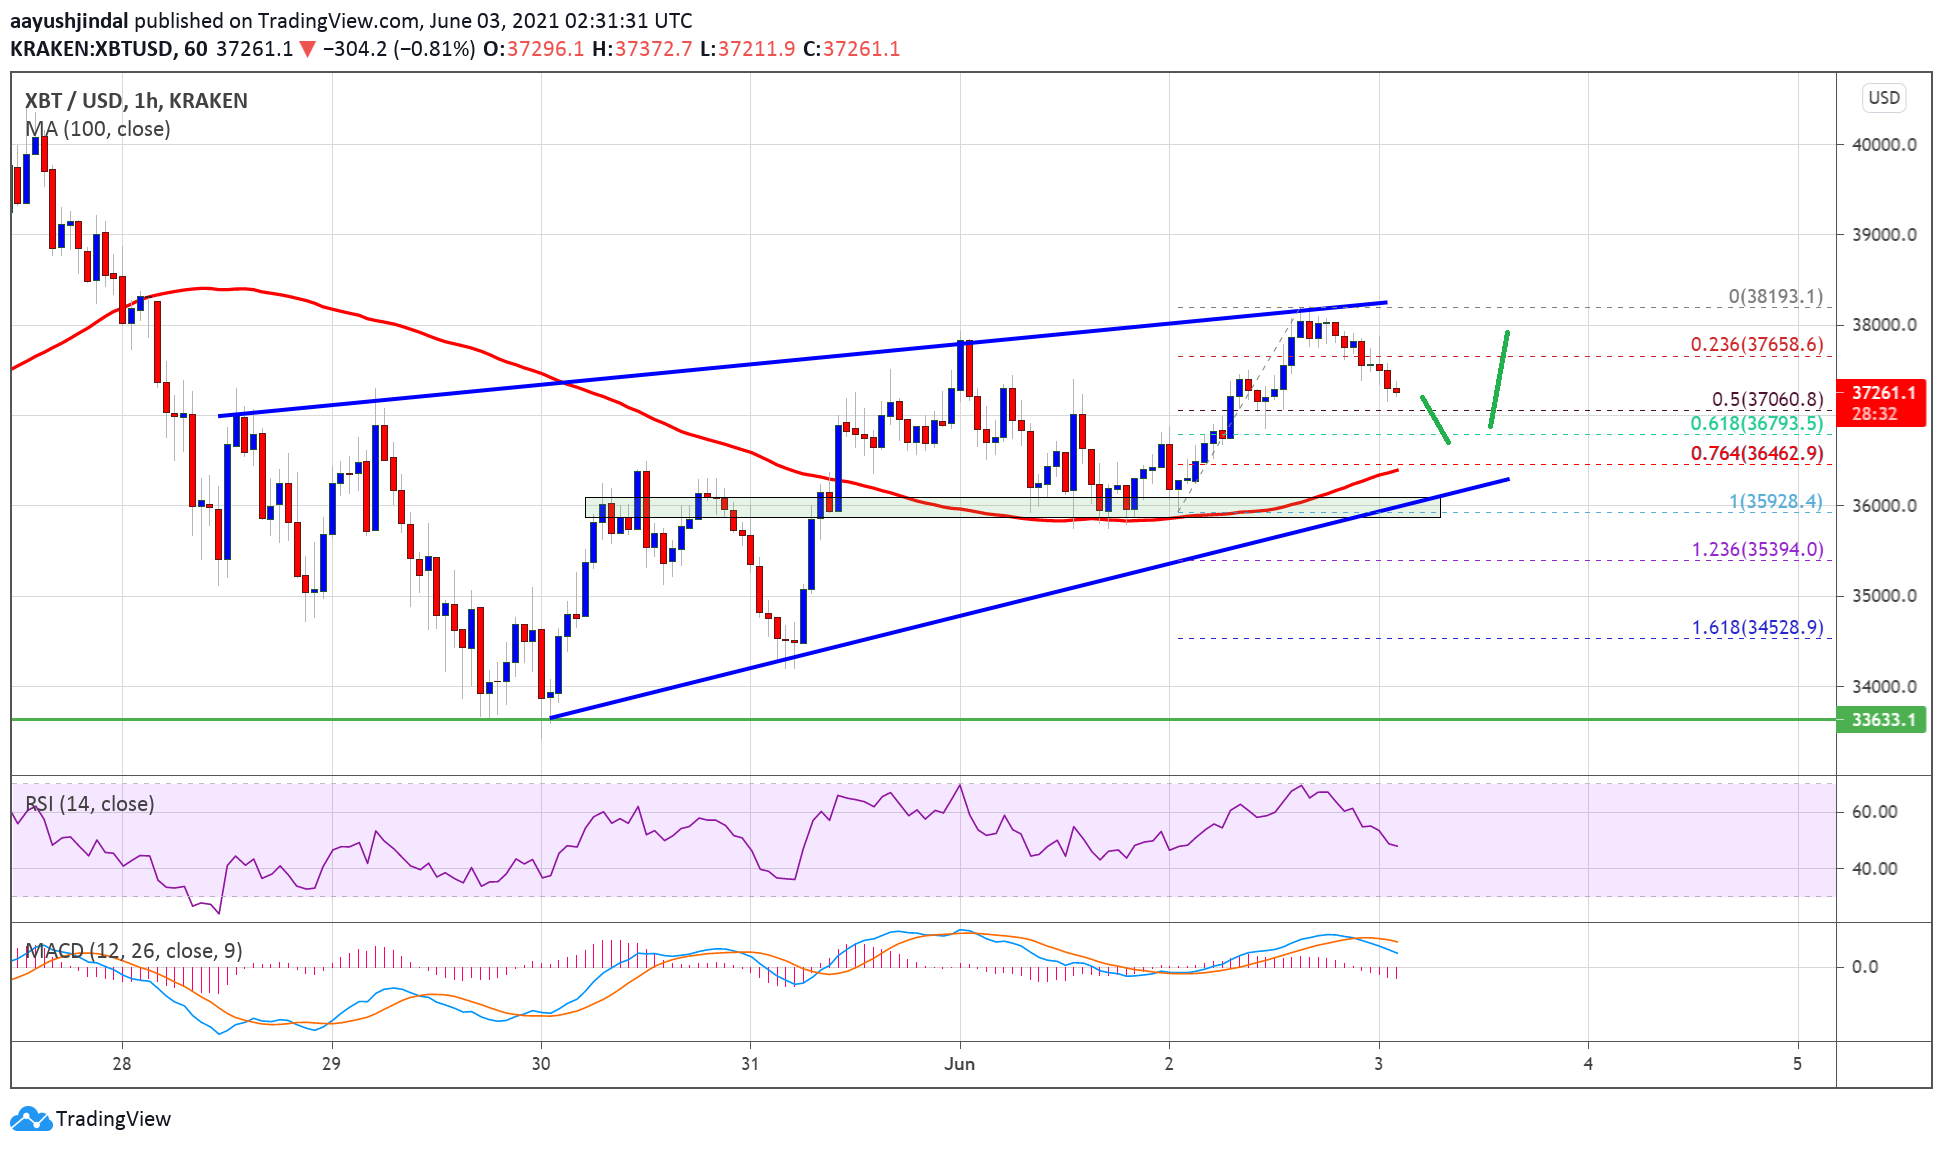
Source: BTCUSD on TradingView.com
The 50% Fib retracement level of the recent wave from the $35,928 swing low to $38,200 high is also near the $37,000 zone to act as a support. There is also a connecting bullish trend line forming with support near $36,400 on the hourly chart of the BTC/USD pair.
On the upside, an immediate resistance is near the $37,600 level. The first major resistance is near the $37,850 level. The main barrier is still near the $38,000 zone. A clear break above the $38,000 zone is needed for a push towards the $40,000 level.
Downside Break in BTC?
If bitcoin fails to clear the $38,000 resistance, it could correct lower. An initial support on the downside is near the $37,000 level.
The first major support is near the $36,500 level and the 100 hourly simple moving average. If there is a downside break below the $36,500 support and then the trend line, the price could start a major decline in the near term.
Technical indicators:
Hourly MACD – The MACD is slowly gaining pace in the bearish zone.
Hourly RSI (Relative Strength Index) – The RSI for BTC/USD is now just below the 50 level.
Major Support Levels – $36,500, followed by $36,000.
Major Resistance Levels – $37,800, $38,000 and $40,000.
Source: Read Full Article