TA: Bitcoin Turns Red, What Could Trigger More Downsides
Bitcoin price struggled to recover above the $46,000 resistance against the US Dollar. BTC could continue lower below the $44,200 support zone in the near term.
- Bitcoin is facing a major resistance near the $45,500 and $46,000 levels.
- The price is now trading below $45,000 and the 100 hourly simple moving average.
- There is a major bearish trend line forming with resistance near $45,500 on the hourly chart of the BTC/USD pair (data feed from Kraken).
- The pair could accelerate further lower if there is a clear break below the $44,200 level.
Bitcoin Price Remains At Risk
Bitcoin price traded as low as $44,258 before it attempted an upside correction. BTC managed to recover above the $45,000 resistance level.

There was a break above the 50% Fib retracement level of the recent decline from the $47,200 swing high to $44,258 low. The price even spiked above the $45,500 resistance zone, but upsides were limited.

Bitcoin failed to surpass the $46,000 resistance zone. There is also a major bearish trend line forming with resistance near $45,500 on the hourly chart of the BTC/USD pair. It seems like the pair struggled to clear the trend line and topped just below the 61.8% Fib retracement level of the recent decline from the $47,200 swing high to $44,258 low.
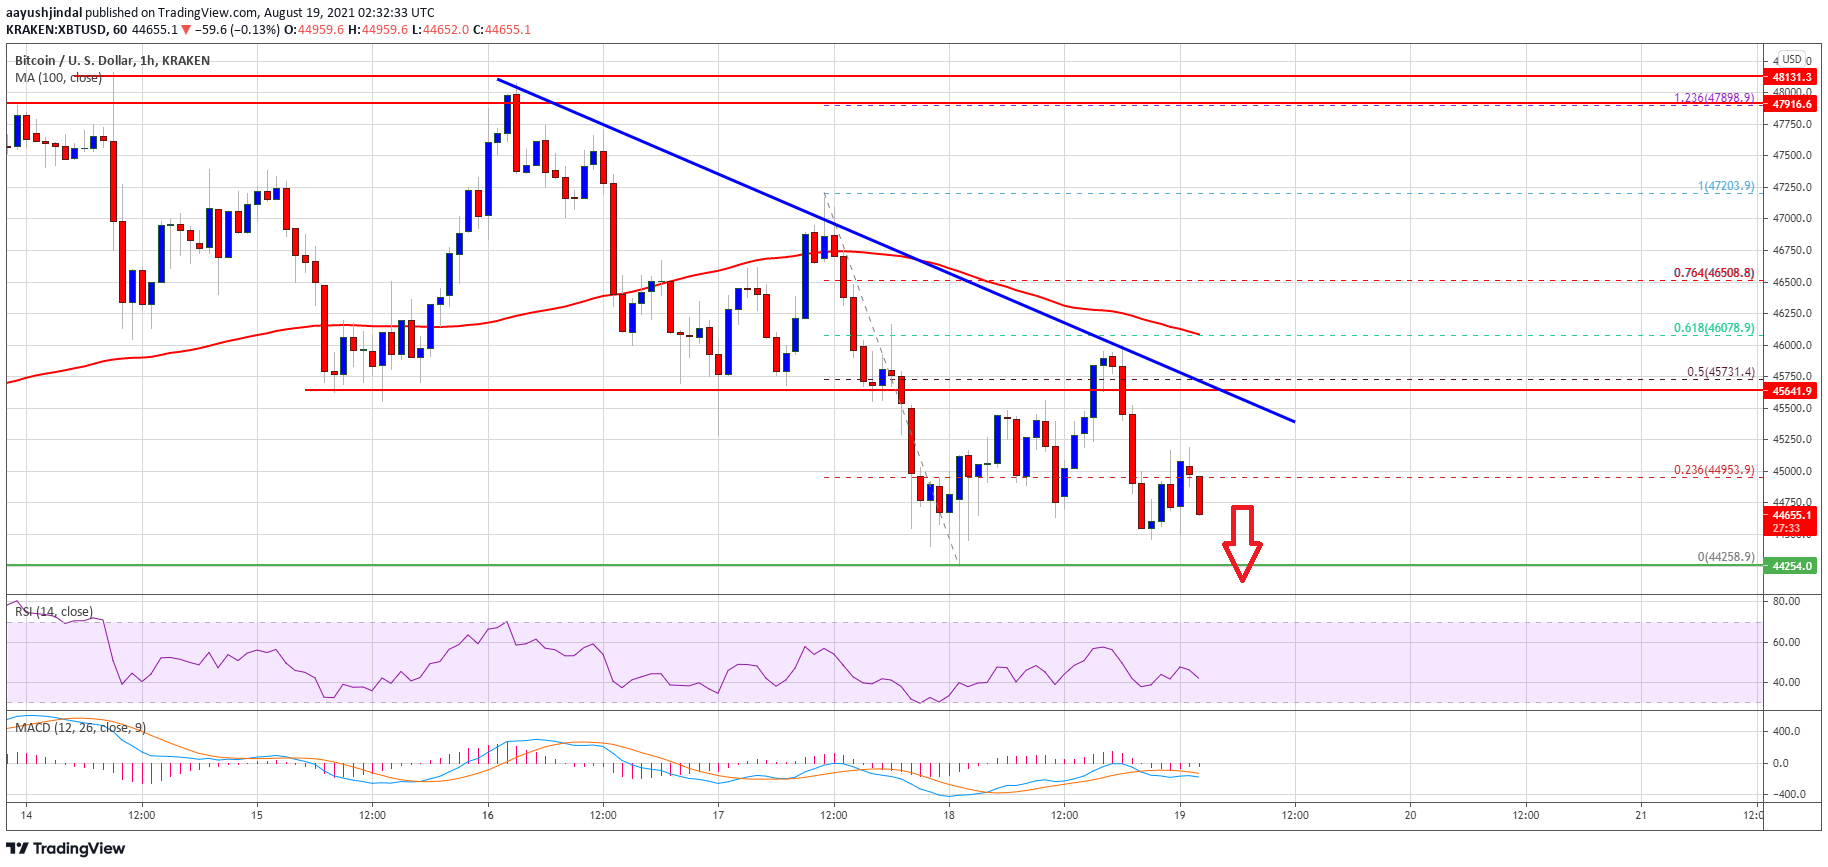
Source: BTCUSD on TradingView.com
It is now trading below $45,000 and the 100 hourly simple moving average. On the upside, an immediate resistance is near the $45,000 level. The first key resistance is near the $45,500 level and the trend line. If bitcoin clears the $45,200 and $45,500 resistance levels, it could attempt more gains above the $46,000 level.
More Losses in BTC?
If bitcoin fails to climb above the $45,200 and $45,500 resistance levels, it could extend its decline. An initial support on the downside is near the $44,250 level.
The first major support is now near the $44,000 zone. The next key support is now near the $43,800 level. If there is a clear break below $43,800, the price could dive towards the $40,000 support zone. An intermediate support sits near the $42,000 level.
Technical indicators:
Hourly MACD – The MACD is gaining pace in the bearish zone.
Hourly RSI (Relative Strength Index) – The RSI for BTC/USD is now below the 40 level.
Major Support Levels – $44,200, followed by $43,800.
Major Resistance Levels – $45,200, $45,500 and $46,000.
Source: Read Full Article