TA: Why Bitcoin Price Remains At Risk for a Fresh Drop to $30K
Bitcoin price recovered above $34,000, but it struggled near $35,000 against the US Dollar. BTC is currently declining and it remains at a risk of more losses below $32K.
- Bitcoin struggled to gain momentum above $34,500 and remained below $35,000.
- The price is currently well below $33,000 and it is testing the 100 hourly simple moving average.
- There is a key bullish trend line forming with support near $32,400 on the hourly chart of the BTC/USD pair (data feed from Kraken).
- The pair is likely to continue lower towards $31,500 and $30,800 in the near term.
Bitcoin Price Fails Near $35K
Yesterday, there was a decent recovery in bitcoin price above the $33,800 and $34,000 resistance levels. BTC even broke the $34,500 level and settled above the 100 hourly simple moving average.

However, the bulls struggled to gain strength above $34,500 and the price remained below $35,000. A high was formed near $34,872 before the price started a fresh decline. There was a break below the $34,000 and $33,800 support levels.
Bitcoin price declined below the 50% Fib retracement level of the upward move from the $30,943 swing low to $34,872 high. It is now trading well below $33,000 and it is testing the 100 hourly simple moving average.
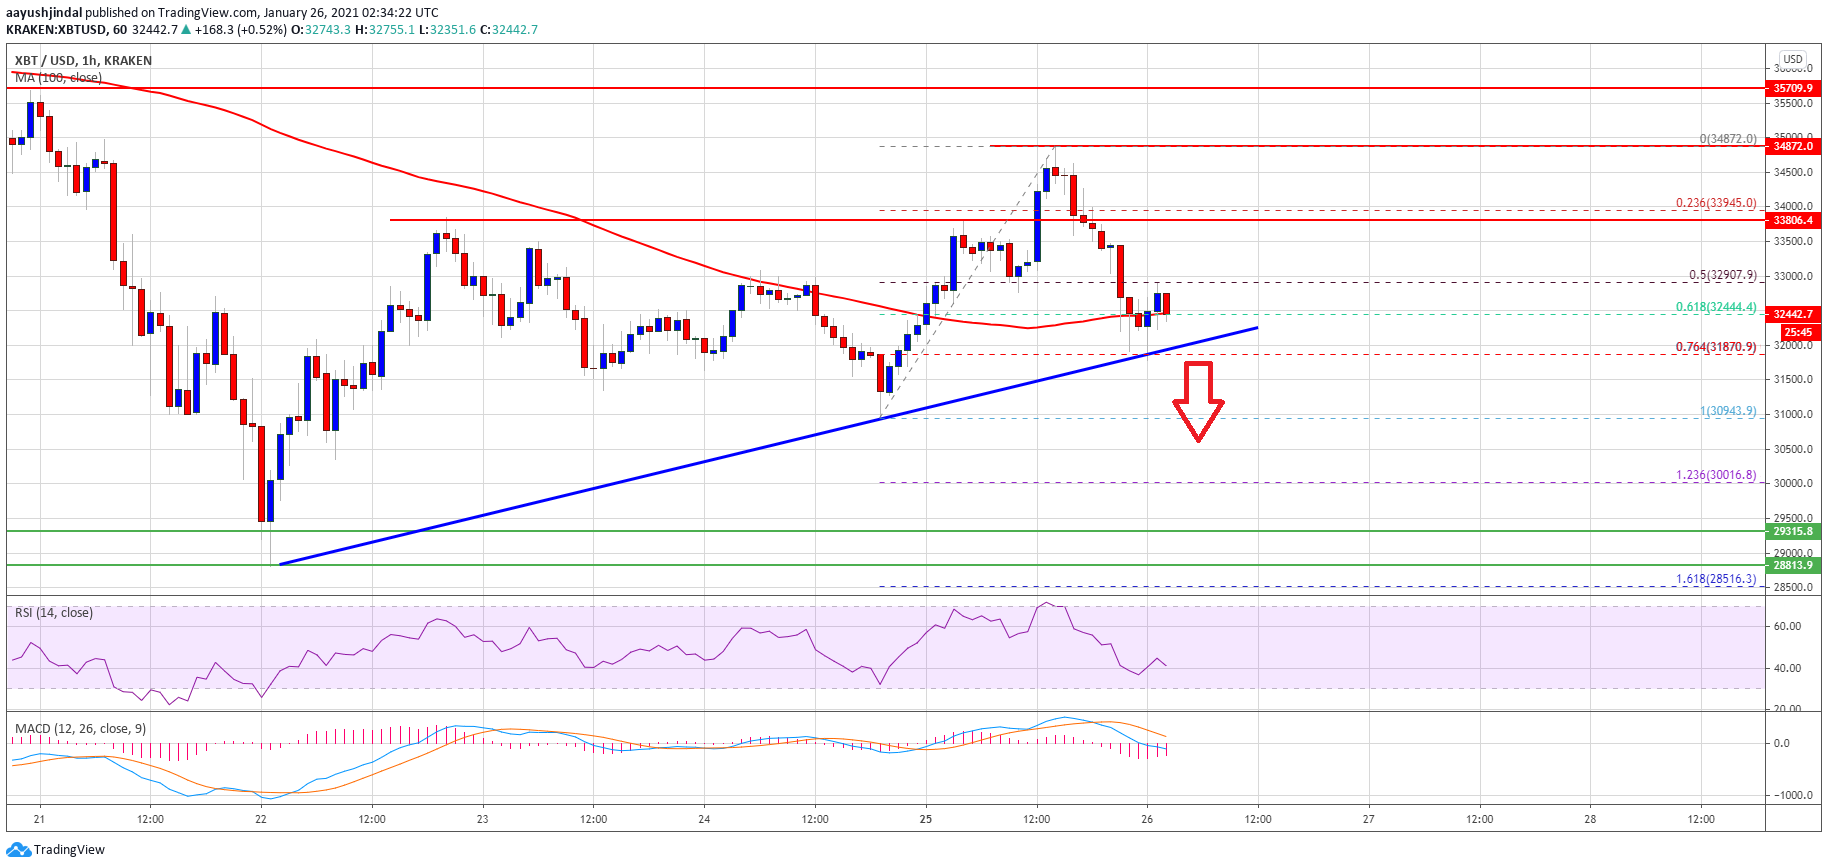
Source: BTCUSD on TradingView.com
There is also a key bullish trend line forming with support near $32,400 on the hourly chart of the BTC/USD pair. The trend linen is close to the 76.4% Fib retracement level of the upward move from the $30,943 swing low to $34,872 high.
A downside break and close below $32,000 could start another decline. In the stated case, the price is likely to continue lower towards the $30,800 support or even $30,000.
Fresh Upsides in BTC?
If bitcoin stays above the $32,400 and $32,000 support levels, it could start a fresh increase. An initial resistance on the upside is near the $33,000 level.
The first major resistance is near the $33,800 level. The main resistance is still near the $34,500 and $35,000 levels, above which the price is likely to accelerate higher in the near term.
Technical indicators:
Hourly MACD – The MACD is slowly gaining momentum in the bearish zone.
Hourly RSI (Relative Strength Index) – The RSI for BTC/USD is now well below the 50 level.
Major Support Levels – $32,400, followed by $30,800.
Major Resistance Levels – $33,000, $33,800 and $34,500.
Source: Read Full Article