Bitcoin Cash Analysis: Bulls Face Hurdles Near $200
Bitcoin cash price is struggling below $200 against the US Dollar, similar to bitcoin. BCH/USD could start a fresh decline if it stays below $200.
Bitcoin Cash Price Analysis
Bitcoin cash price made a few attempts to gain strength above $210 and $215. However, BCH failed to gain pace and started a fresh decline below the $200 level.

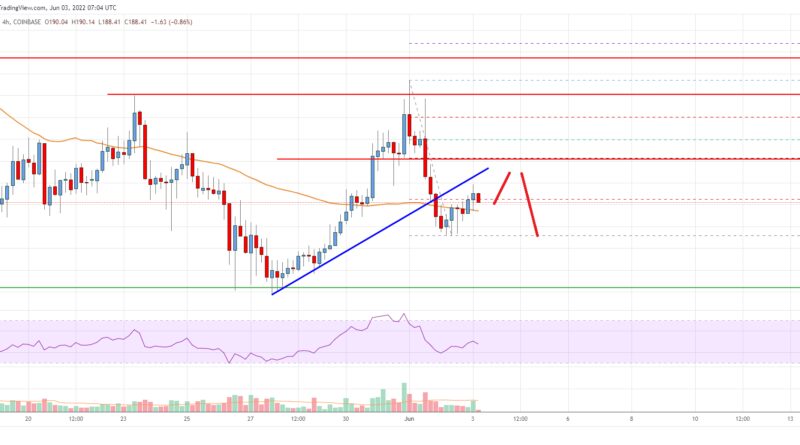
There was a move below the $188 level and the 55 simple moving average (4-hours). Besides, there was a break below a key bullish trend line with support near $189 on the 4-hours chart of the BCH/USD pair. The price even traded below the $185 support and formed a low near $182.
It is now correcting losses above the $185 level. There was a move above the 23.6% Fib retracement level of the recent decline from the $210 swing high to $182 low.
On the upside, the price is now facing resistance near the $192 level. The next major resistance is near the $200 level. It is near the 50% Fib retracement level of the recent decline from the $210 swing high to $182 low. The main hurdle sits near the $210 level.
A clear break above $210 and $215 might send the price towards the $240 barrier. Any more gains above $240 could set the pace for a larger increase.
An immediate support on the downside is near the $185 zone. The next major support is near the $182 level, below which the bears might gain strength. The next target for them may perhaps be near the $172 level.

Bitcoin Cash Price
Looking at the chart, bitcoin cash price is now trading above the $185 zone and the 55 simple moving average (4-hours). Overall, the price must clear $200 and $210 to start a fresh increase in the near term.
Technical indicators
4 hours MACD – The MACD for BCH/USD is slowly losing pace in the bullish zone.
4 hours RSI (Relative Strength Index) – The RSI for BCH/USD is now below the 50 level.
Key Support Levels – $182 and $172.
Key Resistance Levels – $200 and $210.
Source: Read Full Article