
Bitcoin Cash Is Trapped In A Narrow Range As It Is Stuck At $120
Bitcoin Cash (BCH) price is in a downtrend, falling to $110.07.
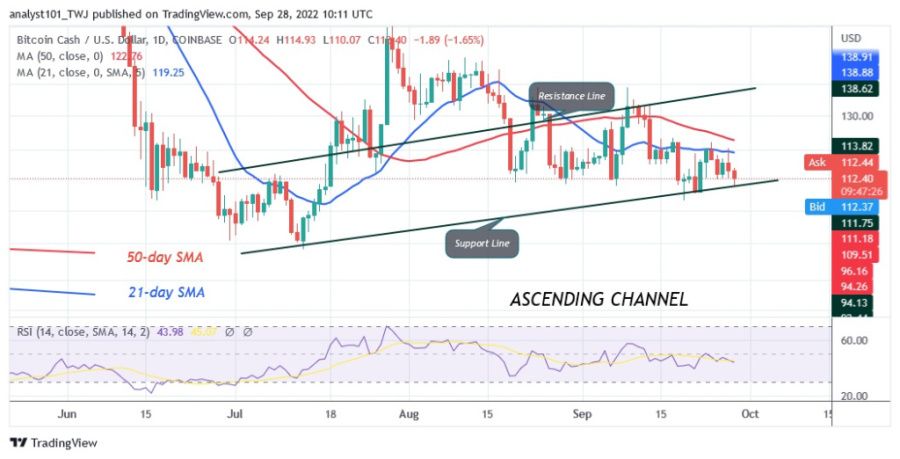
Today, BCH is trading above the $110 support, which is the historical price level from August 19. The cryptocurrency is now trading in a narrow range.
Bitcoin Cash Price Long-Term Analysis: Bearish

The upside is limited by the 21-day line SMA. This was confirmed on September 24 and 27, when the price was rejected at the recent high. The altcoin is trading in a narrow range between $110 and $120. On the upside, a price rise above the current support will catapult BCH above the moving average lines. Conversely, BCH will fall further to the low of $96 if the current support is breached.
Bitcoin Cash Indicator Reading
The cryptocurrency is at level 44 of Relative Strength for the period 14. It is in a downtrend as it falls back to the previous low. BCH The price bars of the cryptocurrency are below the moving average lines, which indicates a further price decline. The price of the cryptocurrency is below the 20% range of the daily stochastic. The altcoin has fallen into the oversold zone of the market. The market will resume its upward movement.
Technical Indicators
Key resistance zones: $130 and $150
Key support zones: $120 and $100
What is the next move for Bitcoin Cash (BCH)?
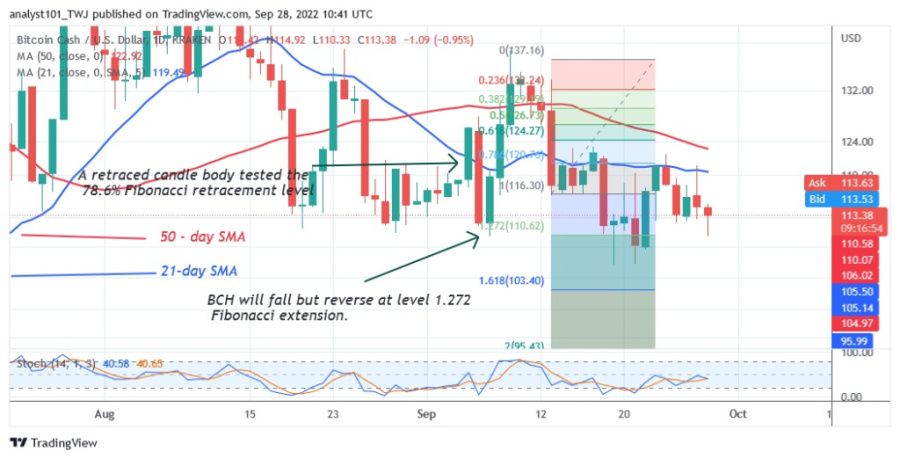
BCH The downtrend of Bitcoin Cash has reached its bearish exhaustion. The cryptocurrency’s price is hovering above the current support for a possible upside move. Meanwhile, the downtrend from September 13 has shown a candlestick body testing the 78.6% Fibonacci retracement level. The retracement suggests that BCH will fall to the Fibonacci extension level of 1.272 or $110.62.
Disclaimer. This analysis and forecast are the personal opinions of the author and are not a recommendation to buy or sell cryptocurrency and should not be viewed as an endorsement by Coin Idol. Readers should do their own research before investing in funds.
Source: Read Full Article