
Bitcoin Cash Struggles Below $108 And Targets $115 High
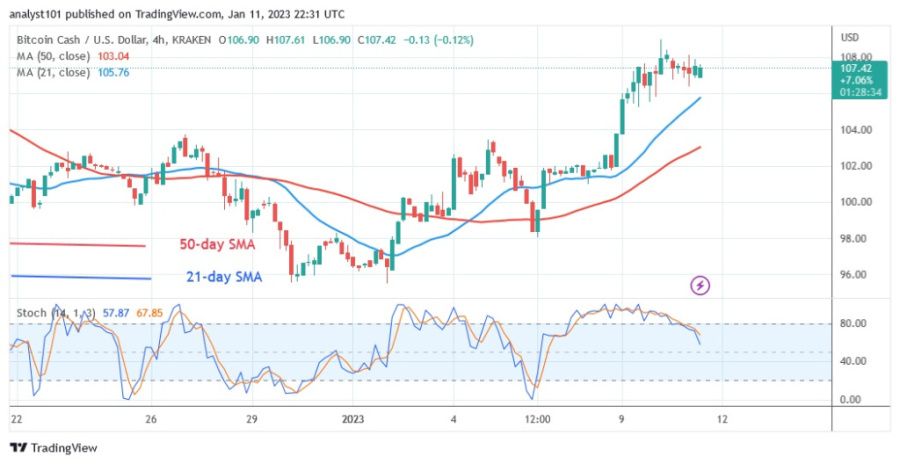
Bitcoin Cash (BCH) is trading in the bullish trend zone as it crosses above the moving average lines.
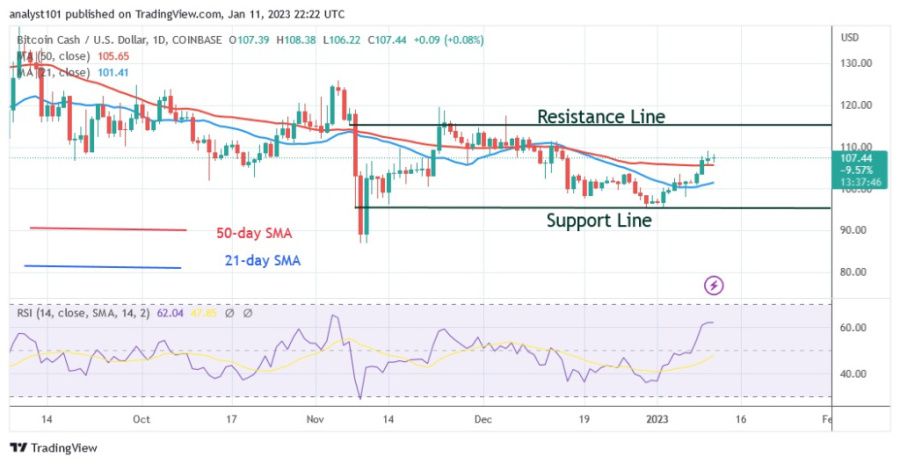
Bitcoin Cash price long term analysis: bearish
The cryptocurrency price rises to a high of $109 before falling. The upside is approaching the overbought area of the market. If the current support remains above the moving average lines, BCH will rise and return to its previous high of $115. BCH will fall down if the price drops below the 50-day line SMA. The altcoin will fall and return to its previous low of $95. The price of the cryptocurrency fluctuates in a narrow range between $95 and $115.
Bitcoin Cash indicator display

BCH is at level 62 of the Relative Strength Index for the period 14. The altcoin is in an uptrend and has room for further increase. The fact that the price bars are above the moving average lines suggests that the price of the cryptocurrency could rise. The altcoin’s daily stochastic is below the 80 level, which suggests that BCH could be bearish.
Technical indicators
Key resistance zones: $160, $180, $200
Key support zones: $120, $100, $80
What is the next direction for BCH /USD?
As long as the price bars above the moving average lines, BCH is likely to rise. The uptrend is rejected at the high of $108. The market will rise but reverse at the high of $110.90 if current resistance is broken. Buyers are struggling to keep the price above the resistance at $108 in the meantime.
Disclaimer. This analysis and forecast are the personal opinions of the author and are not a recommendation to buy or sell cryptocurrency and should not be viewed as an endorsement by Coin Idol. Readers should do their own research before investing in funds.
Source: Read Full Article