Bitcoin, Ether, Major Altcoins – Weekly Market Update December 13, 2021
The total crypto market cap added $18 billion to its value for the last seven days and now stands at $2,242 billion. The top 10 coins were all in red for the same time period with Binance Coin (BNB) and Cardano (ADA) being the worst performers with 3 and 2.4 percent of losses respectively. Bitcoin (BTC) is currently trading at $48,860 while ether (ETH) is at $4,013.
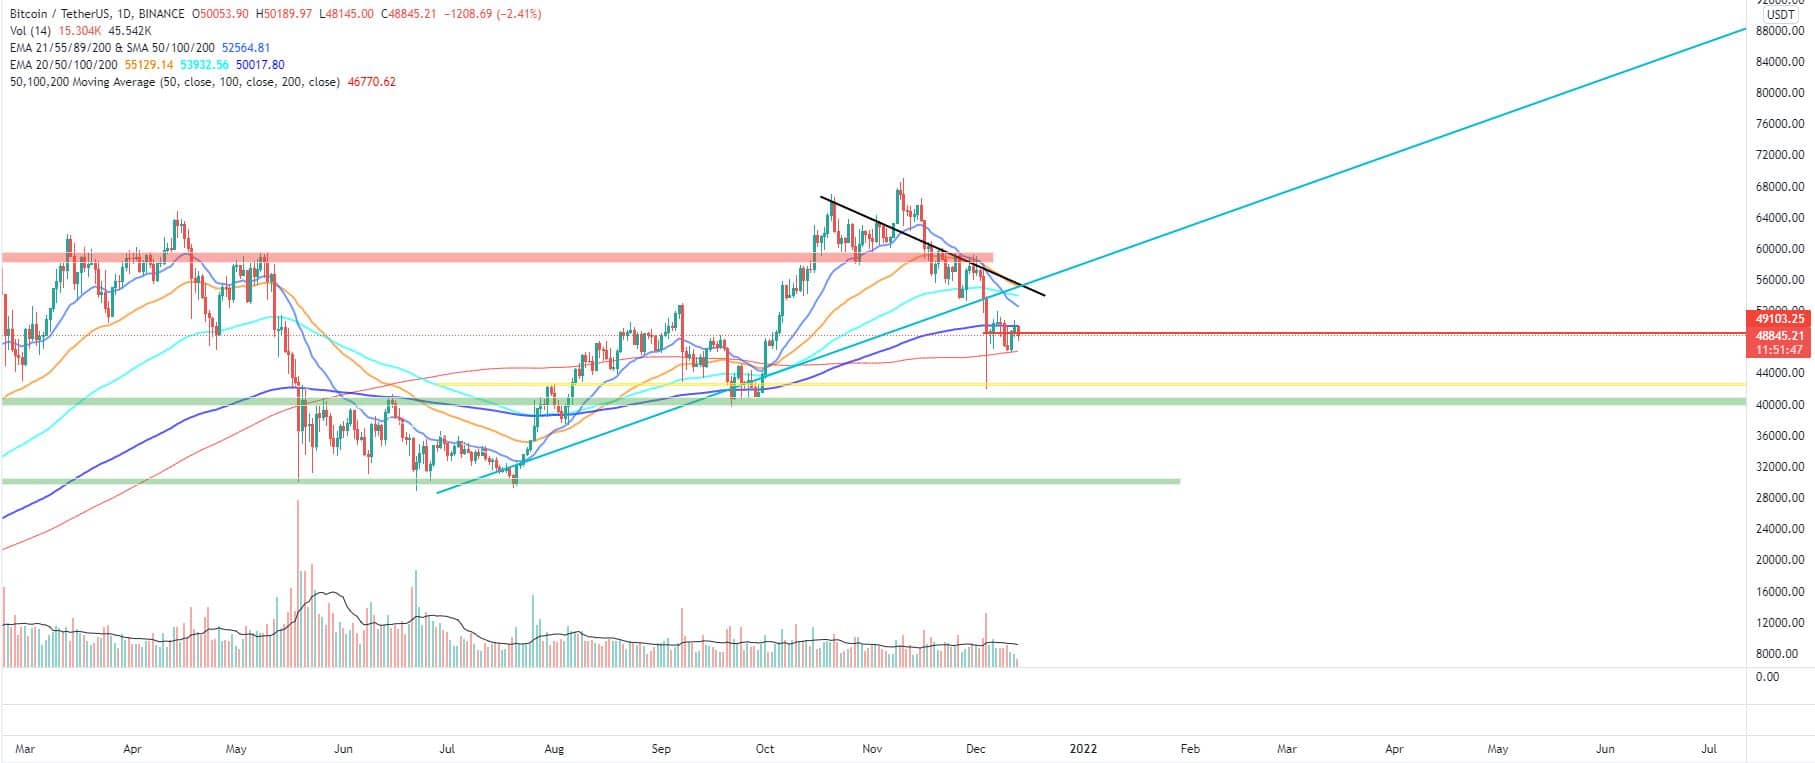
BTC/USD
Bitcoin closed the trading day on Sunday, December 5 at $49,300, registering a 13.9 percent loss on a seven-day basis, after somehow managing to bounce from the $42,000 low reached during the previous sessions.

The Relative strength indicator (RSI) hit oversold values not seen since the May 2021 market crash.
The BTC/USDT pair started the new week with a drop to $47,000 on Monday morning. Bulls, however, took quick action and pushed the price up to $50,400 in the evening part of the session to close in green.
Traders were divided in their analysis of the market behavior and the current price action with some pointing out a healthy correction while others were expecting more downside and selling pressure in the coming days and weeks.
The Tuesday session was not bad for buyers either. The price of bitcoin climbed up to $51,950 during intraday, but most of the gains were retraced before the daily candle close.
The mid-week trading day on Wednesday came with a re-test of the newly established short-term support of near $49,000. Bears failed to break the level, which resulted in another flat close for BTC.
On Thursday, December 9 we saw a clear bearish rectangle pattern forming on the daily chart. This resulted in a break to the downside and a 5.8 percent loss for the biggest cryptocurrency. It moved below the 200-day EMA for the first time since September 28.
The BTC/USDT pair made another low on Friday by closing the workweek at $47,000.
The weekend of December 11-12 started with a solid bullish engulfing candle on Saturday. Bulls were quite active and helped the coin regain positions above $49,000, adding 4.5 percent.
Then on Sunday, bitcoin continue to rise and ended the week at $50,120.
As of the time of writing, it is trading at $48,860, right below the previous local support at $49,000.
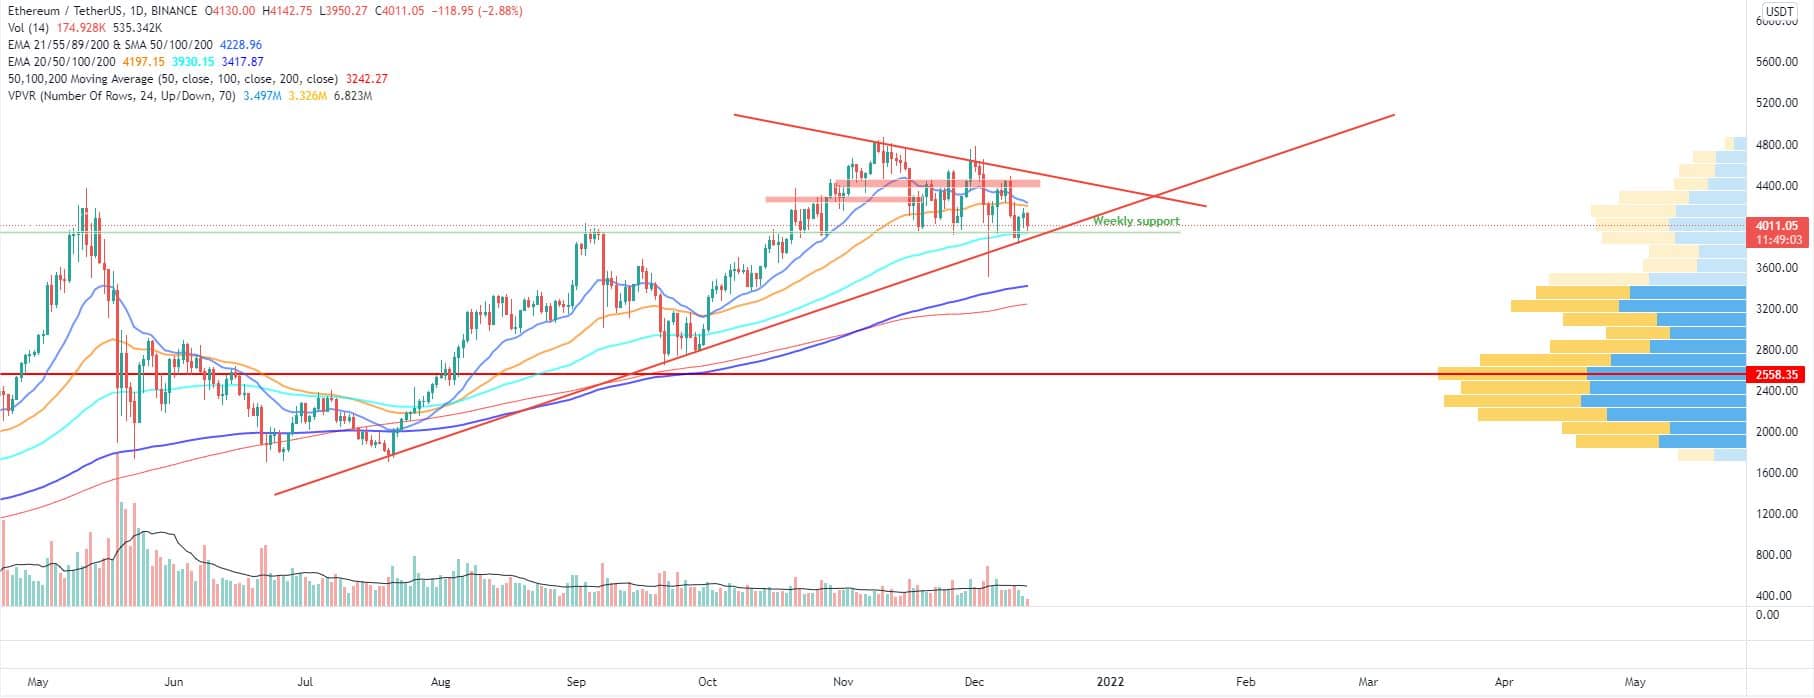
ETH/USD
The Ethereum project token ETH has been performing significantly better than BTC recently. First, the coin fully recovered from the December 4 drop, and secondly, it managed to go back above the weekly uptrend line in just a few days.
It closed the previous week with a 2.6 percent loss, but still 19.2 percent above the $3,500 low registered during the flash crash
It is worth mentioning that ETH was trading in the extremely wide range between $3,500 and $4,700 in the November, 29 – December 5 period.
On Monday, December 6 the ether jumped 3.6 percent up to reach $4,345 but not before once again hitting the weekly support near $3,900 during intraday trading.
The Tuesday session came with a short pullback to $4,300 – the zone where the 21-day EMA and the VPVR’s Point of Control were both located at that point in time.
The third day of the workweek saw a strong move to the upside – a 3.2 percent jump to $4,439. ETH was outperforming bitcoin as the ETHBTC pair hit a 3.5 year high.
On Thursday, December 9, the ether lost 9.5 percent of its value in the aftermath of what many considered de-facto default of the Chinese housing giant Evergrande. From a technical standpoint, there was a bear flag pattern on the daily chart. The coin once again lost the weekly trendline.
The Friday session was no different and the ETH/USDT continued to move South, reaching the weekly support and 100-day EMA at $3,900.
The first day of the weekend came with a solid green candle from bulls. The ETH token moved 5 percent up to reach a zone near $4,076.
On Sunday, December 12, we saw an extension of the reversal to the upside with the price hitting $4,137 at the daily candle close.
What we are seeing on Monday is renewed selling activity. ETH is trading at $4,012 but remains above the diagonal uptrend.
Leading Majors
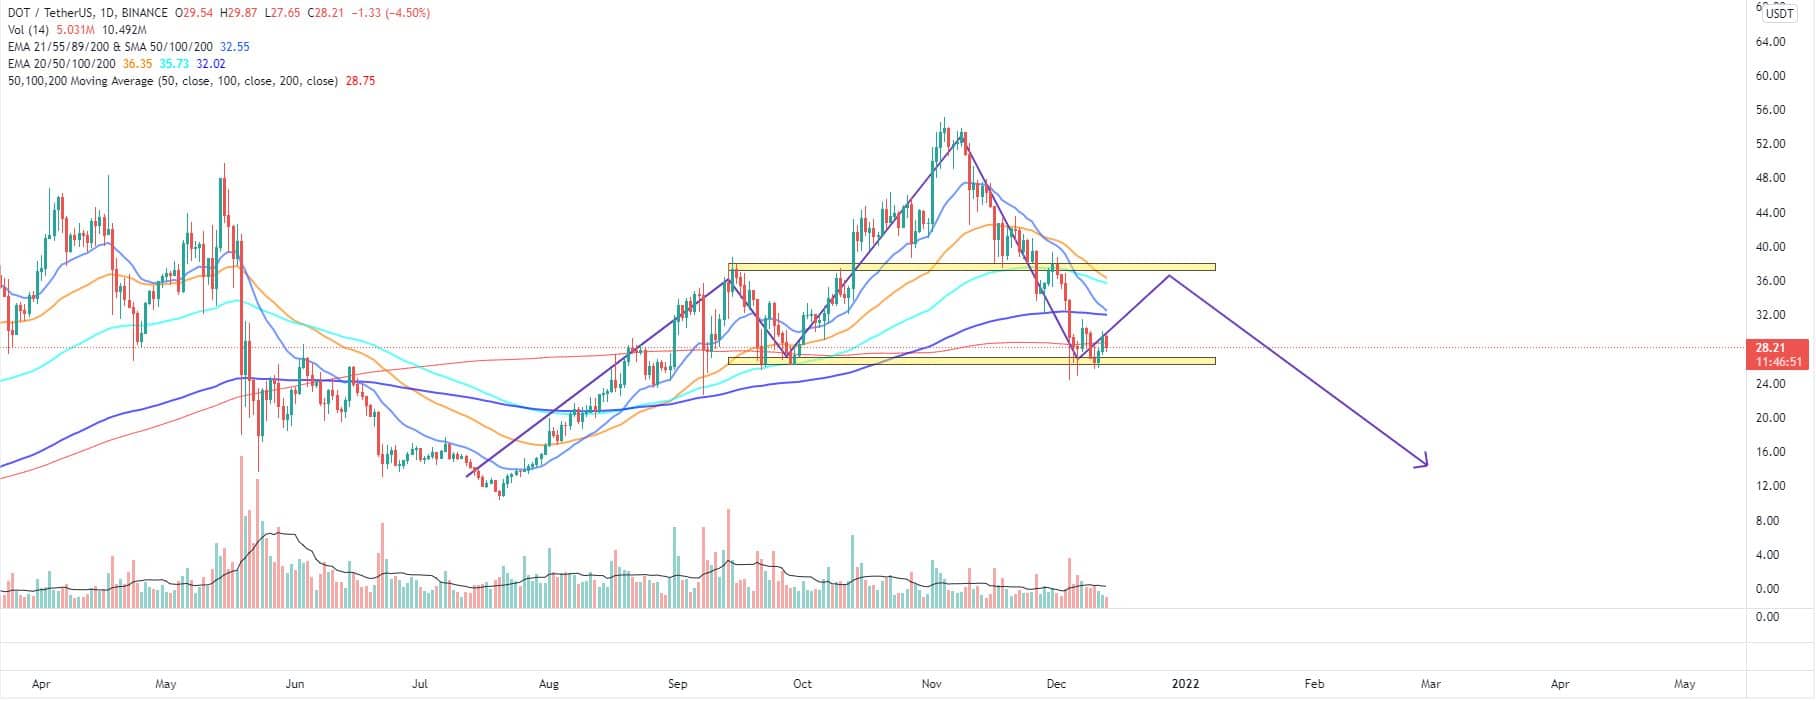
- Polkadot (DOT)
Polkadot has been underperforming ever since it hit its all-time high at $55 on November 4. The parachains auctions start and the enormous amount of DOT tokens locked as a result could not support the price growth.
The DOT/USDT pair retraced by 55 percent to hit a 3-month low at $24 last week. Still, it showed clear signs of exhaustion of the selling activity. This, combined with the strong horizontal support/resistance line near the $25-$26 zone (on both daily and weekly timeframes) could suggest a potential short-term move to the upside with a target somewhere around the September high at $35.
On the daily chart, we can clearly see a head and shoulders pattern is formed with the mentioned target level as the next logical point that will conclude the right shoulder.
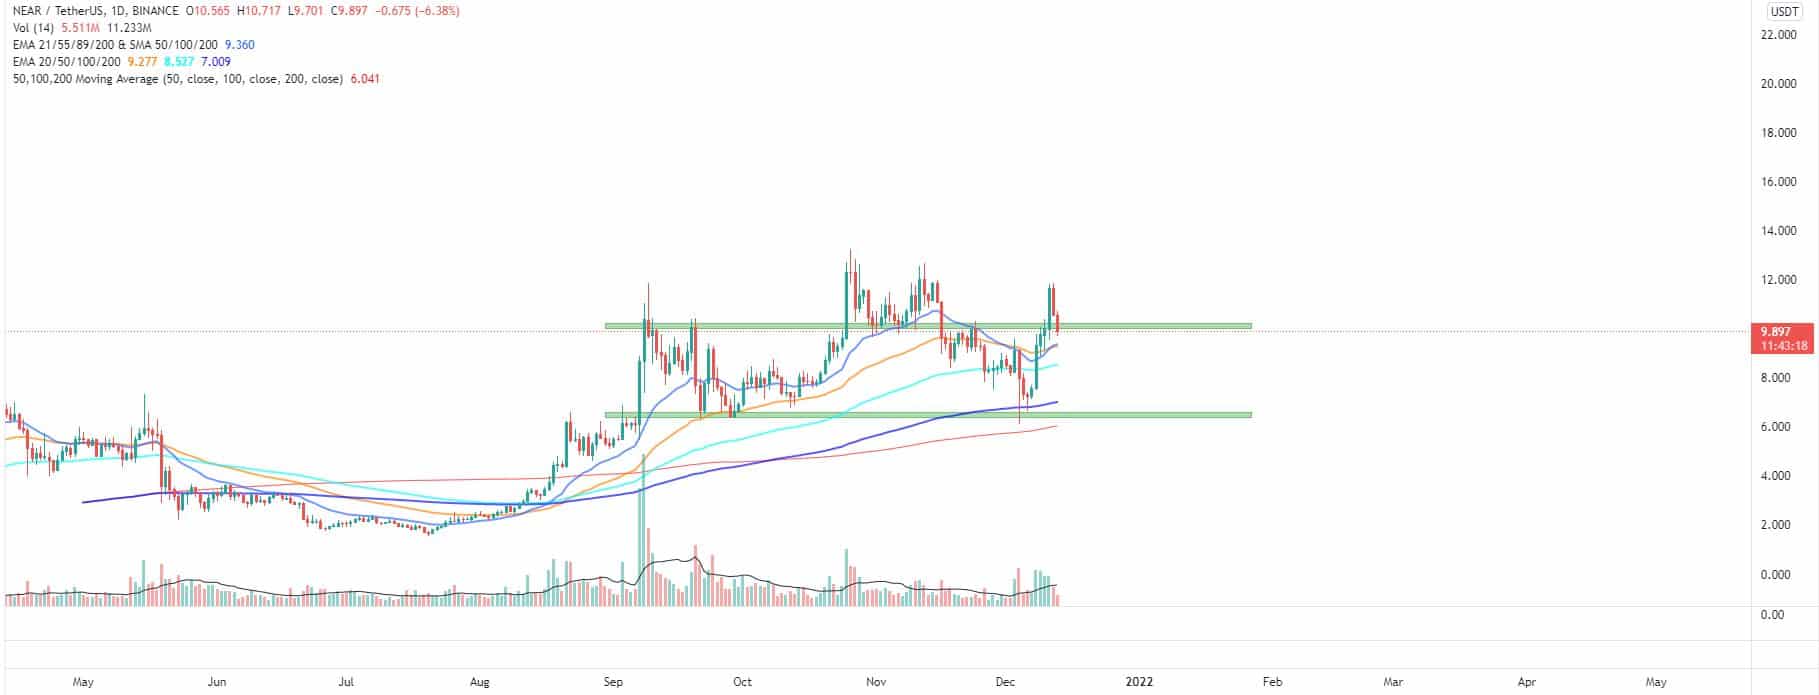
Altcoin of the Week
Our Altcoin of the week is Near (NEAR). The popular Layer 1 blockchain and Ethereum competitor was one of the best-performing assets for the past seven days. It jumped 42 percent after finding support at the $7.5 horizontal line where the 21-day EMA is also situated.
The coin completed a 53 percent retrace from its all-time high values registered in October and the renewed trading interest resulted in a quick reversal to the upside.
In late October, the NEAR team announced an $800 million fund to support its ecosystem growth.
The token is currently ranked at #32 on the CoinGecko Top 100 list with a total market cap of approximately $5.6 billion. It registered a weekly high of $11.8 on December 11 and is currently trading at $9.8.
The next levels of resistance are the September high at $12 up to the all-time high at $13.3. Support at $10.
Related posts:
Source: Read Full Article