
Here's Why Bitcoin Could Break At Least $33,000 In This Rally
Bitcoin may be able to break the $33,000 mark in the current rally if this historical pattern of an on-chain indicator is anything to go by.
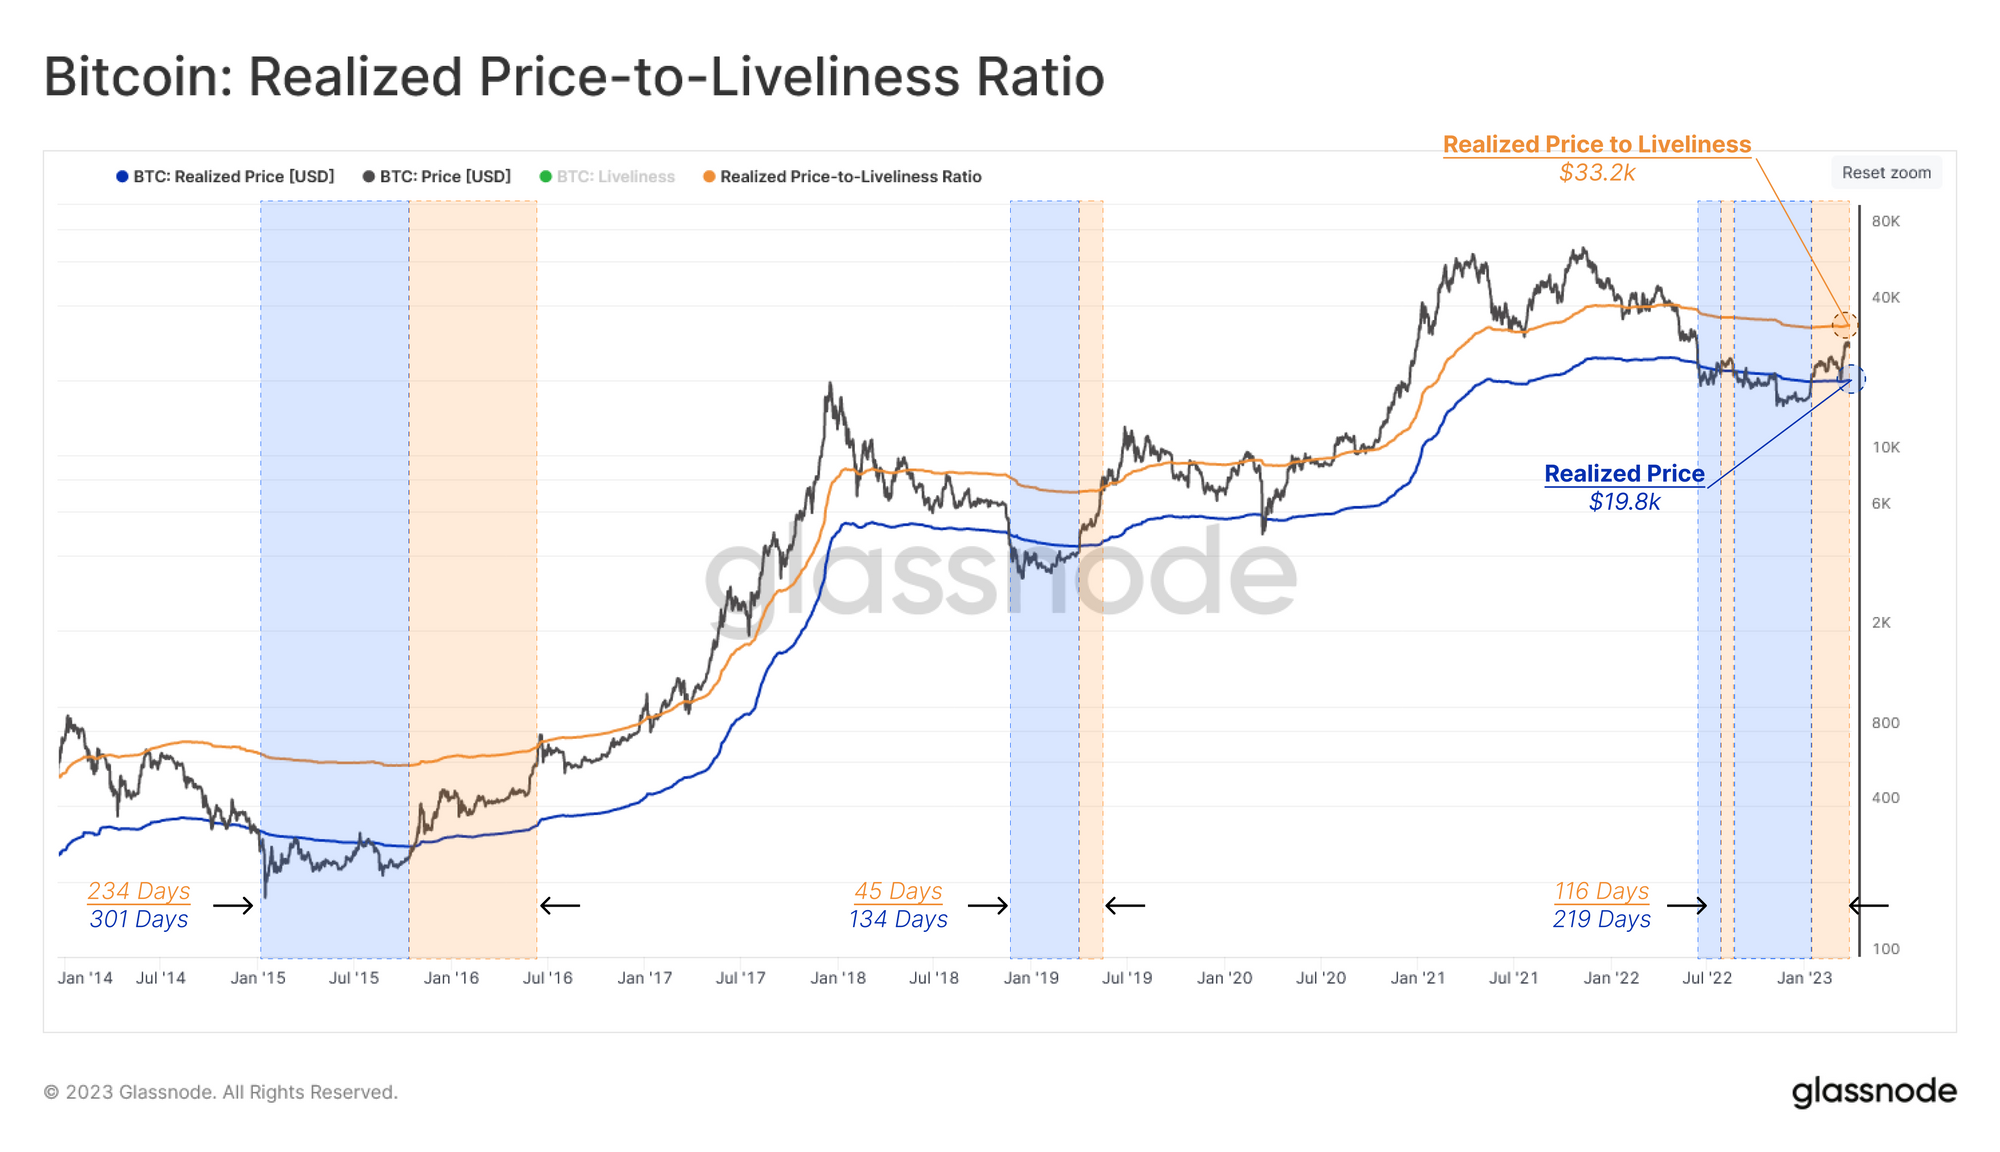
Bitcoin Realized Price-To-Liveliness Ratio Has A Value Of $33,200 Currently
According to the latest weekly report from Glassnode, BTC is currently in a range that has historically been associated with a macro transitional phase. The indicator of interest here is the “realized price,” which is a value derived from a Bitcoin capitalization model called the realized cap.

Unlike the usual market cap, the realized cap says that the true value of a coin in the circulating BTC supply is the price at which it was last transferred and not the current Bitcoin price.
The realized price is obtained from this model by dividing it by the total number of coins in circulation. The significance of this price is that it represents the cost basis (the acquisition price) of the average holder in the market.
This means that if the normal price dips below this metric’s value, then the average investor in the sector enters into a state of loss. Naturally, a break above the level implies a return of profitability for the market.
Now, the realized price makes the lower bound of the aforementioned macro transitional phase as the worst parts of historical Bitcoin bear markets have occurred when the price has been below this level.
The below chart shows the trend in this indicator:
Looks like the price is significantly above this level now | Source: Glassnode’s The Week Onchain – Week 14, 2023
As displayed in the above graph, Bitcoin broke above the realized price earlier in the year when the ongoing rally first started. This was a signal that the coin had entered into the transitional period between bearish and bullish trends.
The realized price currently has a value of $19,800, which means the coin has now taken quite a distance over it. Now, BTC is not too far from the upper bound of this historical range, which is made by a metric called the realized price-to-liveliness ratio.
This indicator is a modified version of the realized price that accounts for the degree of HODLing taking place on the network. As for why this weighting factor is applied to the realized price, Glassnode explains, “large scale HODLing acts to constrain supply, increasing the estimated ‘fair value’, and vice-versa.”
Currently, the realized price-to-liveliness ratio has a value of around $33,200. From the chart, it’s apparent that tops of bull rallies have historically taken form at or above this level.
The April 2019 rally, with which the current rally shares many similarities, also saw BTC break above this indicator before a top was encountered. If these previous instances are anything to consider, it appears possible that the current rally in the cryptocurrency will also at least touch the upper bound of this transitional zone.
A retest of this level, however, doesn’t necessarily have to take place soon. In the 2015-2016 bear market, the asset spent 234 days in this period before it touched the upper bound of this zone. The current cycle has so far seen the coin spend a total of 116 days here.
BTC Price
At the time of writing, Bitcoin is trading around $28,300, up 6% in the last week.

Source: Read Full Article