
Polkadot Faces Restrictions below $8, and May Further Decline
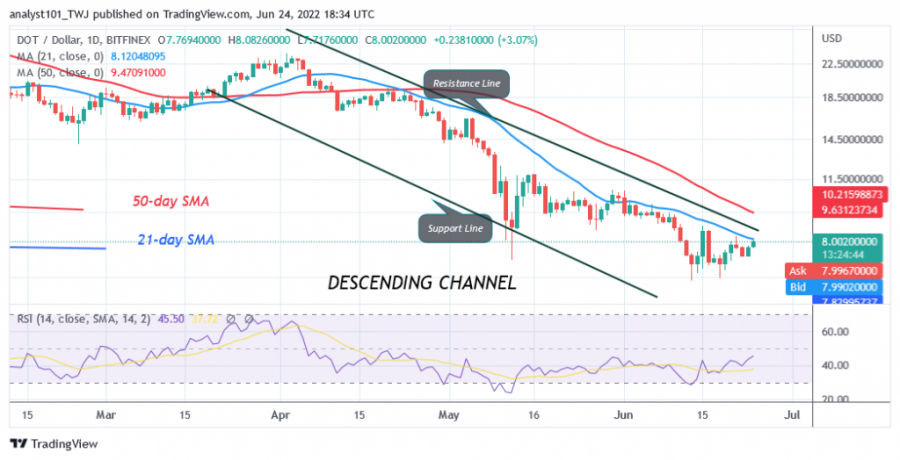
The price of Polkadot (DOT) is in a downtrend, but buyers are trying to break the 21-day line SMA. Today, the cryptocurrency is trading at $8.12, but it is restricted by the 21-day line SMA. The altcoin will rise to $9.80 if the bulls break the 21-day line SMA.
The bullish momentum will continue above the 50-day line SMA. Conversely, DOT/USD will fall to the previous low of $6.37 if it turns away from the 21-day line SMA. Nevertheless, the downtrend will resume and Polkadot will continue to fall to $4.23 if the current support is broken.
Polkadot indicator analysis

The altcoin is at level 46 of the Relative Strength Index for the period 14. It is in the downtrend zone despite the upward correction. DOT is below the moving averages, which indicates a further decline. DOT is above the 50% area of the daily stochastic. The market is in a bullish momentum.
Technical indicators:
Major Resistance Levels – $28 and $30
Major Support Levels – $16 and $14
What is the next direction for Polkadot?
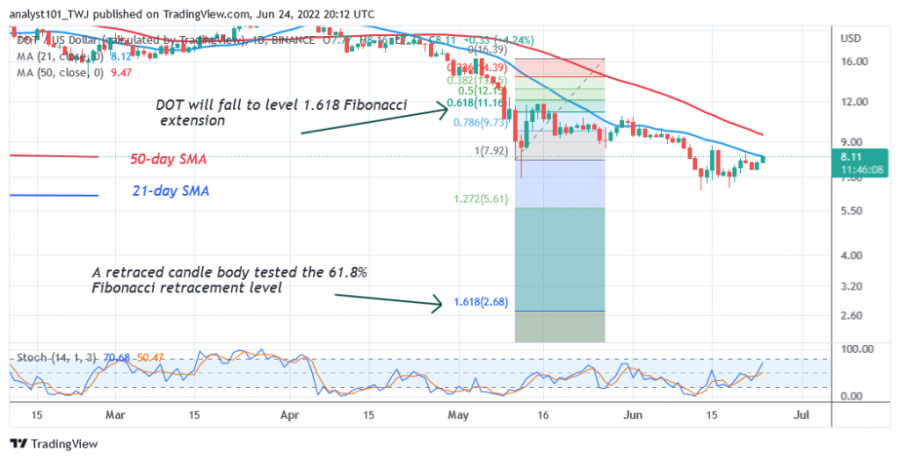
Polkadot is facing a rejection at the 21-day line SMA. There is a possibility of further decline. Meanwhile, on May 11 downtrend, a retraced candle body tested the 61.8% Fibonacci retracement level. The retracement suggests that the price of DOT will fall to the level of the Fibonacci extension of 1.618 or to the level of $2.68.
Disclaimer. This analysis and forecast are the personal opinions of the author and are not a recommendation to buy or sell cryptocurrency and should not be viewed as an endorsement by CoinIdol. Readers should do their research before investing funds.
Source: Read Full Article