Polkadot Price Analysis: DOT outpaces other altcoins, lifting toward record highs
Polkadot is trading in the green while contributing to renewing the crypto bull cycle. At the time of writing, DOT is up nearly 9% to trade slightly above $36. The last seven days have seen the token hold onto the uptrend staged from support at $28.
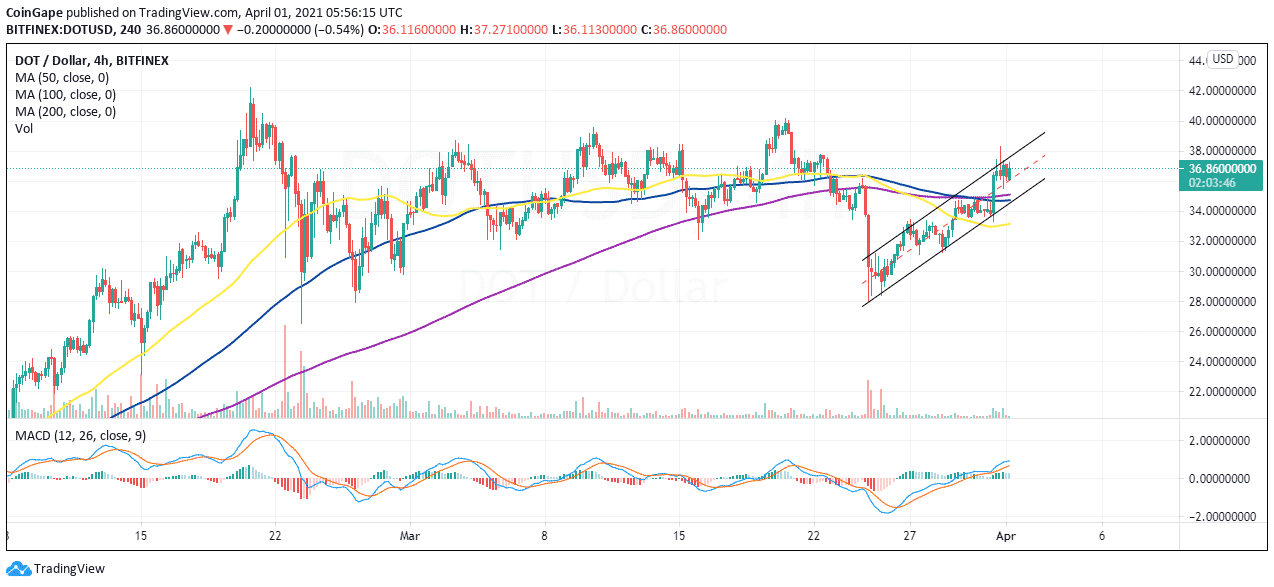
The four-hour chart shows Polkadot trading within the confines of an ascending parallel channel. The lower boundary support has kept the bears in check; however, the upper boundary limits price action.

At the time of writing, DOT holds on top of the middle boundary support. Closing the day above this anchor would emphasize market stability. On the other hand, investors waiting on the sidelines are likely to be attracted into the market as speculation builds for gains beyond $40.
Note that Polkadot is comfortably in the bulls’ hands, as illustrated by the four-hour Moving Average Convergence Divergence (MACD) indicator. The MACD line (blue) crossed above the signal line on March 26, suggesting that it was time for bulls to take control. The indicator’s return into the positive region confirmed the bullish narrative.
DOT/USD four-hour chart
It is worth mentioning that price action above the ascending channel resistance would trigger massive buy orders, adding weight to the tailwind. Delays would be expected at $38, but trading above $40 would become apparent if the price sails through.
On the downside, losses may come into play if DOT fails to close the day above the channel’s middle layer support. An increase in overhead pressure would be accentuated by panic due to market instability, thus validating correction back to $30 and $28, respectively.
Polkadot intraday levels
Spot rate: $36.7
Trend: Bullish
Volatility: Low
Support: $30 and $28
Resistance: $38 and $40
To keep track of DeFi updates in real time, check out our DeFi news feed Here.
Source: Read Full Article