Polkadot Resumes Fresh Uptrend, Targets Resistance at $48
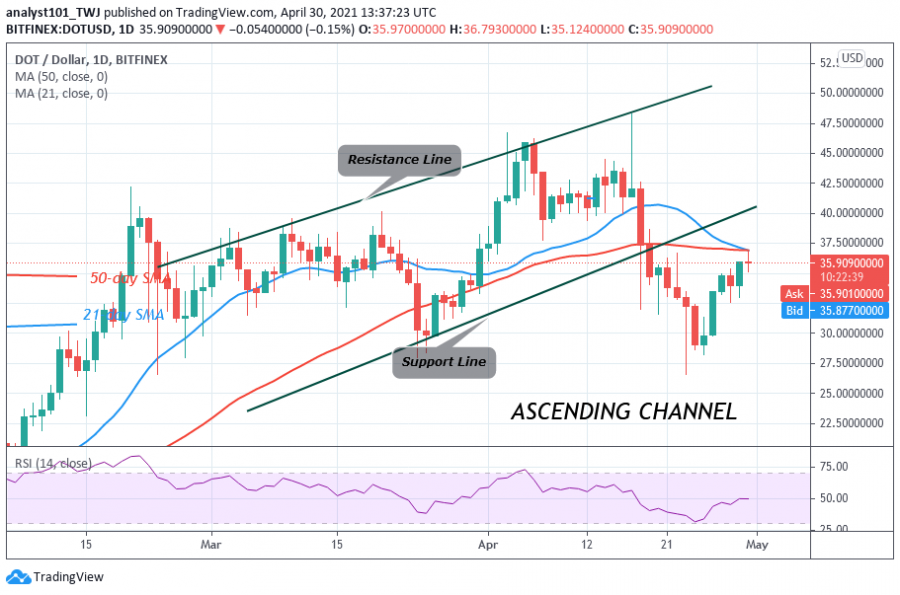
Polkadot (DOT) is making another upward move to retest the $40 overhead resistance. DOT price rebounded above the $28 support to reach the high of $35.97.
April 24 will be the third time; the altcoin will be falling to $28 support. At other times, DOT price has fallen to the previous low on February 25 and March 25. The bottom line is that buyers have not been able to push Polkadot above the $40 resistance.

The other times the overhead resistance was breached, the bullish momentum could not be sustained. The selling pressure above the resistance compelled the altcoin to fall below the overhead resistance. On the upside, Polkadot will have an accelerated price movement to $60 high, if the bulls break the overhead resistance. Conversely, DOT price will continue to be a range-bound if buyers fail to breach the overhead resistance.
Polkadot indicator analysis
DOT/USD has fallen to level 49 of the Relative Strength Index period 14. It indicates that there is a balance between supply and demand. DOT price is below the 21-day SMA and the 50-day SMA which indicates that the altcoin is in the bearish trend zone. Polkadot is capable of falling on the downside.
Technical indicators:
Major Resistance Levels – $48 and $52
Major Support Levels – $32 and $28
What is the next direction for Polkadot?
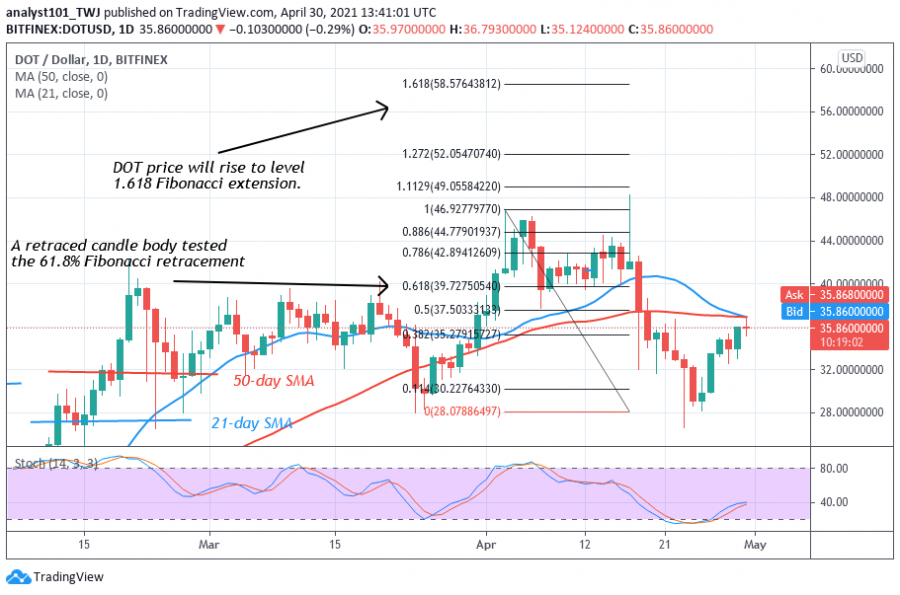
The altcoin has resumed an upward move but the uptrend is facing rejection at the recent high. DOT price will be in the bullish trend zone if price breaks above the SMAs. Meanwhile, on April 3 uptrend; a retraced candle body tested the 61.8 % Fibonacci retracement. This retracement indicates that DOT will rise to level 1.618 Fibonacci extension or a high of $58.57.
Disclaimer. This analysis and forecast are the personal opinions of the author that are not a recommendation to buy or sell cryptocurrency and should not be viewed as an endorsement by CoinIdol. Readers should do their research before investing funds.
Source: Read Full Article