Quant Hovers Above $130 Support And Threatens To Drop Further
The price of Quant (QNT) is falling as it breaks below the moving average lines.
Quant long-term price forecast: declining
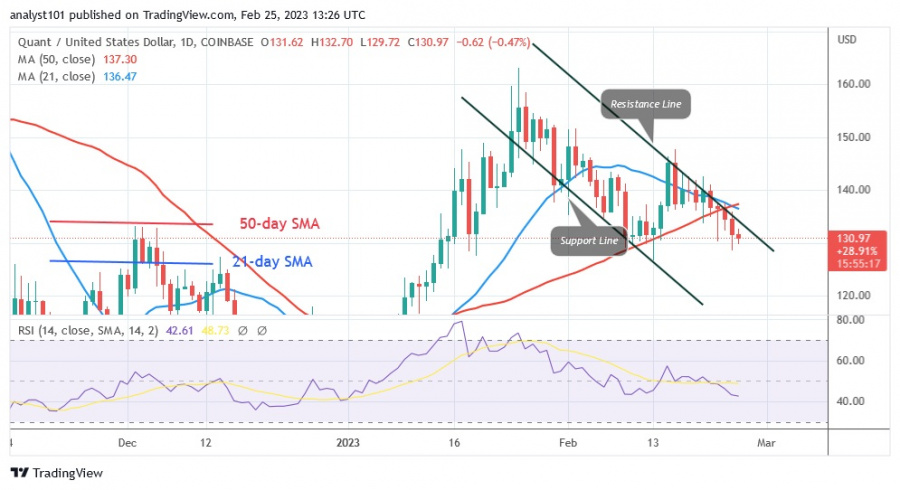
Two rejections at the previous highs of $155 and $145 fueled the downtrend. QNT posted an upside correction after one of the rejections at the $145 high, but failed to break the $145 barrier. On the downside, the cryptocurrency will continue to fall if it drops below the moving average lines. If the $125 barrier is broken, the bearish momentum will continue. If the altcoin reaches the breakout level, the cryptocurrency asset will be in an oversold zone. The crypto asset is currently circling around the $130 support. The current support has been held since January 18. If the current support holds, QNT will continue its upward movement. At the time of writing, the altcoin is trading for $130.
Quant price indicator analysis
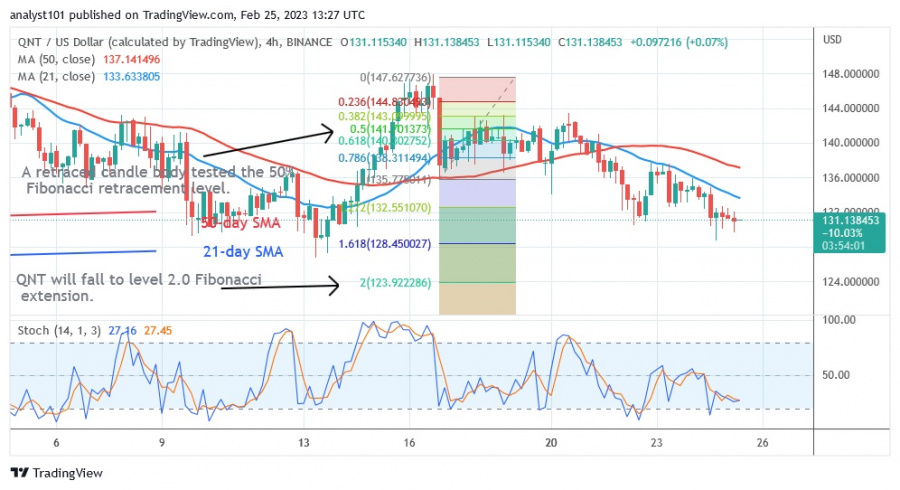
The Relative Strength Index for the 14 period has fallen to 42. The altcoin has entered a bearish trend zone and could fall further. The price of the cryptocurrency could fall as the price bars are below the moving average lines. QNT is experiencing bearish momentum below the daily stochastic threshold of 40.
Technical indicators
Key supply zones: $140, $150, $160
Key demand zones: $120, $110, $100
What is the next move for Quant?
Although the price of cryptocurrencies is currently above $130, Quant is still bearish. If the current support at $130 is broken, the Fibonacci tool analysis will apply. According to the Fibonacci tool study, QNT will fall to the 2.0 level of the Fibonacci extension or $123.92. Bullish candlesticks prevent a decline based on price activity.
Disclaimer. This analysis and forecast are the personal opinions of the author and are not a recommendation to buy or sell cryptocurrency and should not be viewed as an endorsement by CoinIdol. Readers should do their own research before investing in funds.
Source: Read Full Article


