
Quant Loses Value As It Meets Rejection At $125
The price of Quant (QNT) has resumed its downtrend after falling below the moving average lines and the support level of $130.
Quant long-term price forecast: bearish
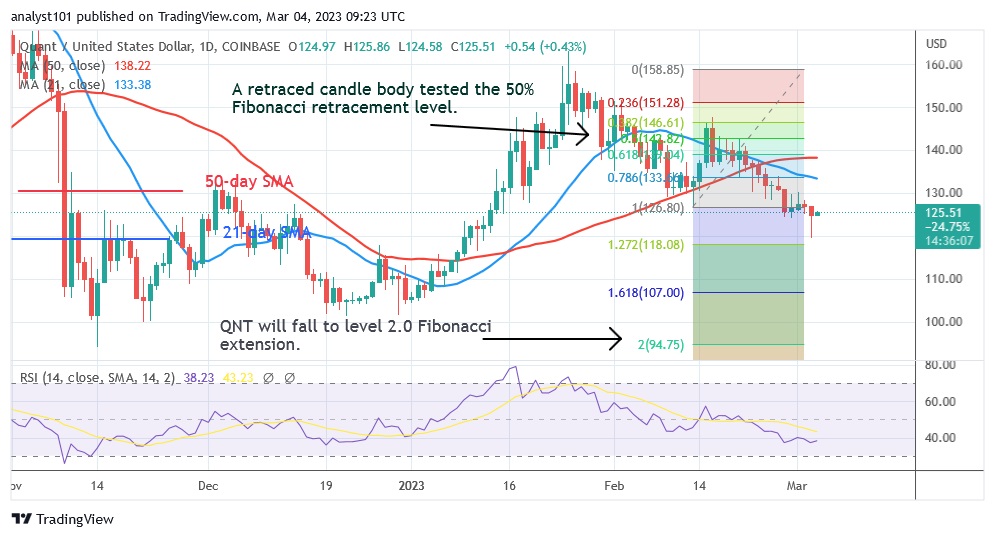
Buyers have consistently supported the $130 price level since February 9. The altcoin recorded an uptrend to a high of $147 on February 15, but was rejected. Buyers were unable to keep the price above $150, which led to the decline. Selling pressure increased once the price fell below the moving average lines. However, the price signal suggests that selling pressure is likely to be negative going forward. In the February downturn, QNT executed an upward correction and a candlestick tested the 50% Fibonacci retracement level. The correction predicts that QNT will fall to the 2.0 Fibonacci extension level, or $94.75. The QNT/USD conversion rate is currently $125.51.
Quant price indicator analysis

The cryptocurrency asset has fallen to Relative Strength Index level 38 for the period 14. QNT could fall further as it reaches the oversold zone of the market. The cryptocurrency’s price bars have fallen below the moving average lines, increasing the selling pressure. Above level 60, the altcoin is gaining momentum.
Technical indicators
Key supply zones: $140, $150, $160
Important demand zones: $120, $110, $100
What is the next step for Quant?
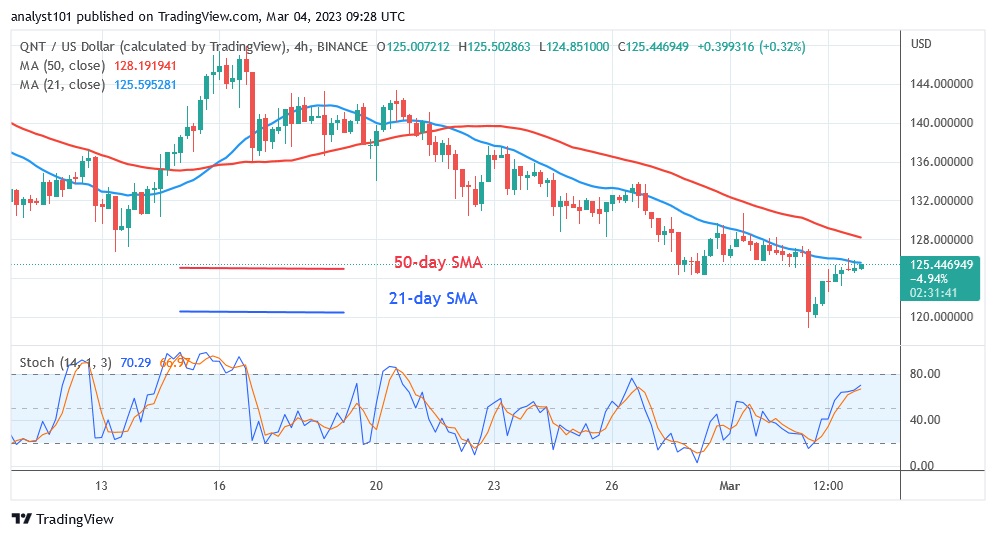
Quant (QNT) is in a steady downtrend. The price bars on the 4-hour chart are below the moving average lines, but are rejected at the 21-day line SMA. QNT has currently climbed to a high of $125 or resistance at the 21-day line SMA. This means that the altcoin will continue to lose value.
Disclaimer. This analysis and forecast are the personal opinions of the author and are not a recommendation to buy or sell cryptocurrency and should not be viewed as an endorsement by CoinIdol. Readers should do their own research before investing in funds.
Source: Read Full Article